
Tribhovandas Bhimji Zaveri Ltd - Breakout Setup, Move is ON...
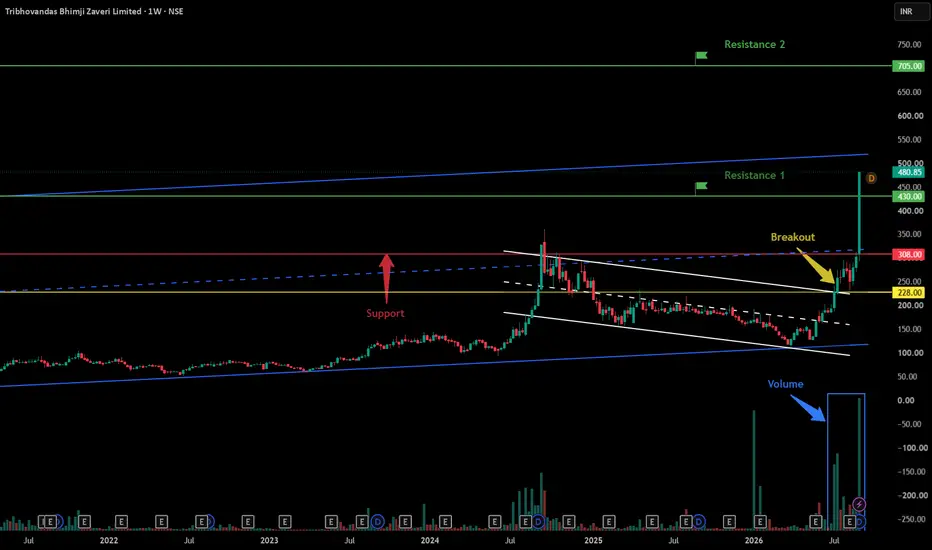
#TBZ trading above Resistance of 430
Next Resistance is at 705
Support is at 308
Here is previous chart:
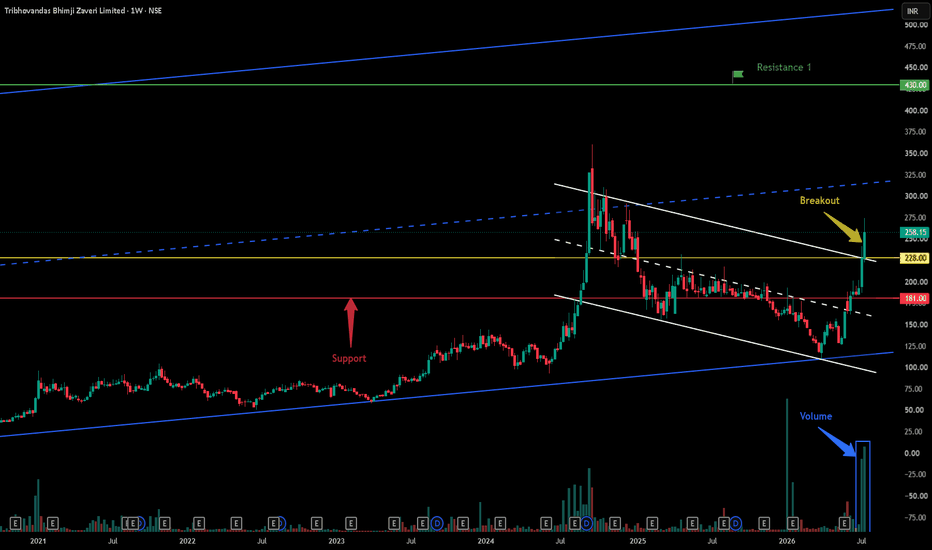
This weekly candlestick chart of Tribhovandas Bhimji Zaveri Limited (TBZ) depicts a major bullish breakout from a prolonged consolidation pattern, accompanied by significant volume expansion.
Chart Overview
Timeframe & Asset: Tribhovandas Bhimji Zaveri Limited (1-Week Chart, NSE).
Current Price: 480.85 INR (+59.38% change shown in the header).
Key Technical Observations
Falling Channel Breakout: The stock consolidated within a downward-sloping channel (white trendlines) through late 2024 and mid-2026. The price decisively broke above the upper boundary of this channel near 228.00 INR, as highlighted by the yellow Breakout arrow.
Volume Spike: A massive blue box highlights a sharp surge in trading volume during the breakout period (mid-2026). High volume validates the strength of the breakout and indicates strong institutional buying interest.
Support Levels:
228.00 INR: The yellow horizontal line serves as the initial breakout level and key dynamic support.
308.00 INR: The red horizontal line (previously a major resistance level tested in late 2024) now acts as primary structural support on any potential pullbacks.
Resistance Levels:
Resistance 1 (430.00 INR): A immediate horizontal level that was cleared during the sharp vertical rally, turning it into short-term support.
Resistance 2 (705.00 INR): A long-term upside projection level marked near the top green line.
Long-Term Trend Lines: The solid blue trendlines extending across the chart highlight long-term structural channels, with the stock recently surging past the long-term upper channel boundary.
A parallel channel (also known as an ascending, descending, or horizontal channel) is a technical analysis pattern bounded by two parallel trendlines that encompass a security’s price action over time.
Structure & Mechanics
Main Components:
Trendline / Base Line: Connects a series of prominent reaction lows (in an uptrend) or reaction highs (in a downtrend).
Channel Line: Drawn parallel to the trendline, connecting the peaks (top boundary) or troughs (bottom boundary).
Price Movement: Price oscillates between the upper boundary (which acts as dynamic resistance) and the lower boundary (which acts as dynamic support).
Types of Channels
Ascending Channel (Bullish): Characterized by higher highs and higher lows. Indicates a steady uptrend where buying pressure dominates.
Descending Channel (Bearish): Characterized by lower highs and lower lows. Represents a controlled downtrend or corrective pullback.
Horizontal Channel (Consolidation): Moving sideways between static support and resistance lines, signaling market indecision or range-bound trading.
How Traders Use Parallel Channels
Trading Within the Range: Buying near the channel's lower boundary (support) and selling or shorting near the upper boundary (resistance).
Breakout Trading: A strong, high-volume candle breaking outside either boundary signals potential trend acceleration or continuation in the direction of the breakout (as seen in the charts provided previously).
Midline (50% Line): Often, a dashed line is drawn down the middle of the channel. Price reacting to this midline can confirm the channel's validity and act as interim support or resistance.
Disclaimer: This is for demonstration and educational purpose only. This is not buying or selling recommendations. I am not SEBI registered financial advisor. Please consult your financial advisor before taking any trade.
Next Resistance is at 705
Support is at 308
Here is previous chart:
This weekly candlestick chart of Tribhovandas Bhimji Zaveri Limited (TBZ) depicts a major bullish breakout from a prolonged consolidation pattern, accompanied by significant volume expansion.
Chart Overview
Timeframe & Asset: Tribhovandas Bhimji Zaveri Limited (1-Week Chart, NSE).
Current Price: 480.85 INR (+59.38% change shown in the header).
Key Technical Observations
Falling Channel Breakout: The stock consolidated within a downward-sloping channel (white trendlines) through late 2024 and mid-2026. The price decisively broke above the upper boundary of this channel near 228.00 INR, as highlighted by the yellow Breakout arrow.
Volume Spike: A massive blue box highlights a sharp surge in trading volume during the breakout period (mid-2026). High volume validates the strength of the breakout and indicates strong institutional buying interest.
Support Levels:
228.00 INR: The yellow horizontal line serves as the initial breakout level and key dynamic support.
308.00 INR: The red horizontal line (previously a major resistance level tested in late 2024) now acts as primary structural support on any potential pullbacks.
Resistance Levels:
Resistance 1 (430.00 INR): A immediate horizontal level that was cleared during the sharp vertical rally, turning it into short-term support.
Resistance 2 (705.00 INR): A long-term upside projection level marked near the top green line.
Long-Term Trend Lines: The solid blue trendlines extending across the chart highlight long-term structural channels, with the stock recently surging past the long-term upper channel boundary.
A parallel channel (also known as an ascending, descending, or horizontal channel) is a technical analysis pattern bounded by two parallel trendlines that encompass a security’s price action over time.
Structure & Mechanics
Main Components:
Trendline / Base Line: Connects a series of prominent reaction lows (in an uptrend) or reaction highs (in a downtrend).
Channel Line: Drawn parallel to the trendline, connecting the peaks (top boundary) or troughs (bottom boundary).
Price Movement: Price oscillates between the upper boundary (which acts as dynamic resistance) and the lower boundary (which acts as dynamic support).
Types of Channels
Ascending Channel (Bullish): Characterized by higher highs and higher lows. Indicates a steady uptrend where buying pressure dominates.
Descending Channel (Bearish): Characterized by lower highs and lower lows. Represents a controlled downtrend or corrective pullback.
Horizontal Channel (Consolidation): Moving sideways between static support and resistance lines, signaling market indecision or range-bound trading.
How Traders Use Parallel Channels
Trading Within the Range: Buying near the channel's lower boundary (support) and selling or shorting near the upper boundary (resistance).
Breakout Trading: A strong, high-volume candle breaking outside either boundary signals potential trend acceleration or continuation in the direction of the breakout (as seen in the charts provided previously).
Midline (50% Line): Often, a dashed line is drawn down the middle of the channel. Price reacting to this midline can confirm the channel's validity and act as interim support or resistance.
Disclaimer: This is for demonstration and educational purpose only. This is not buying or selling recommendations. I am not SEBI registered financial advisor. Please consult your financial advisor before taking any trade.

To Learn Price Action Trading & to get our exclusive breakout charts, subscribe here:
linktr.ee/9amprime
Join Telegram (Free) : t.me/join_9amPrime
Contact us : 9amprime@gmail.com
linktr.ee/9amprime
Join Telegram (Free) : t.me/join_9amPrime
Contact us : 9amprime@gmail.com
Disclaimer
The information and publications are not meant to be, and do not constitute, financial, investment, trading, or other types of advice or recommendations supplied or endorsed by TradingView. Read more in the Terms of Use.