TCS – Retest Breakout Trading Setup with Price Action + Fibonacci Strategy
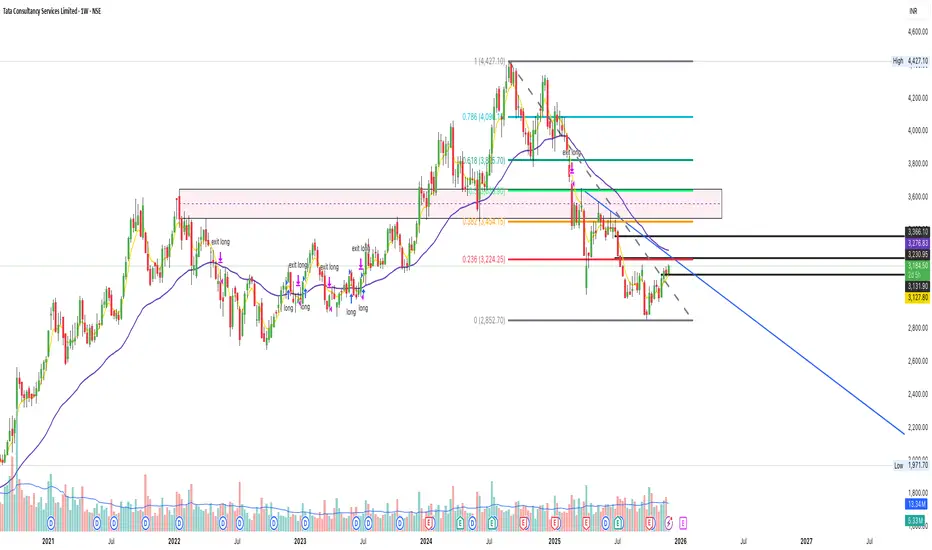
TCS is approaching a key breakout zone around ₹3,280. A retest entry can offer a high-probability trade setup.
How to Trade This Setup
1️⃣ Breakout Level
₹3,280 is the major resistance zone
Wait for strong breakout candle closing above ₹3,280
2️⃣ Retest Entry
📍 After breakout, price may pull back to ₹3,280–₹3,260
📍 Look for bullish rejection candle (Pin bar / Hammer / Engulfing)
👉 Entry on bullish close after retest
3️⃣ Stop-Loss (Price Action Based)
🛑 SL below ₹3,085 (strong support level)
4️⃣ Targets using Fibonacci
🎯 T1: ₹3,350
🎯 T2: ₹3,400
🎯 T3: ₹3,456 (Fib 38.2%)
Strategy Summary
Element Value
Breakout zone ₹3,280
Retest entry ₹3,280–₹3,260
SL ₹3,085
Targets ₹3,350 / ₹3,400 / ₹3,456
Direction Bullish above breakout
View
Bullish bias if price sustains above ₹3,280.
Retest entry gives the safest low-risk setup. 🚀
Disclaimer
The information and publications are not meant to be, and do not constitute, financial, investment, trading, or other types of advice or recommendations supplied or endorsed by TradingView. Read more in the Terms of Use.
Disclaimer
The information and publications are not meant to be, and do not constitute, financial, investment, trading, or other types of advice or recommendations supplied or endorsed by TradingView. Read more in the Terms of Use.