Here’s a **technical analysis summary** for TRENT Ltd (NSE: TRENT) based on the chart you provided:
---
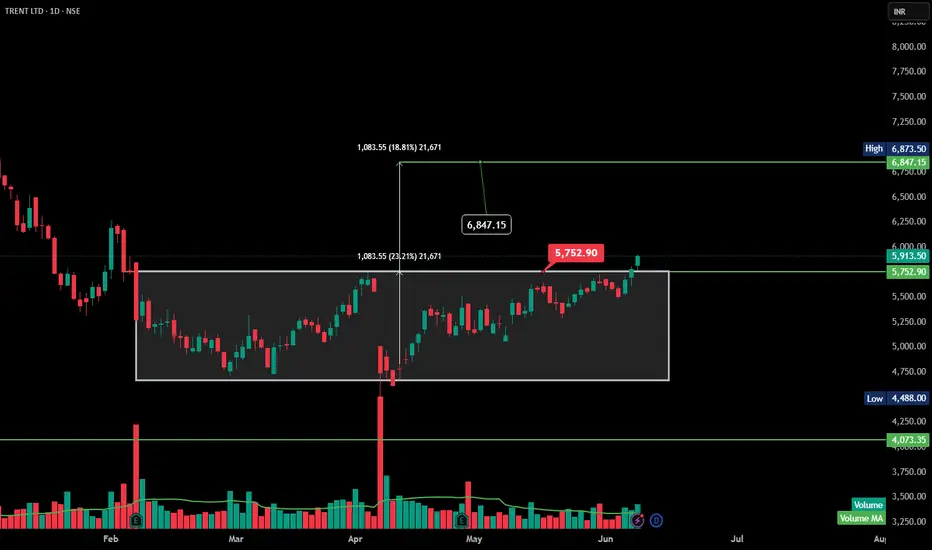
🔍 **Pattern Observed:**
The chart highlights a **rectangle range breakout** or a **horizontal consolidation breakout**. Price was consolidating between \~₹4,670 and ₹5,750 levels for several weeks and has now broken out above ₹5,750, confirming the breakout.
---
🔹 **Key Levels:**
* **Breakout zone:** ₹5,750
* **Current price:** \~₹5,913.50
* **Next resistance/target:** Measured move target around ₹6,847–₹6,900 based on the height of the rectangle (₹1,083.55 added to the breakout point).
* **Support:** ₹5,750–₹5,600 zone.
---
🔹 **Volume is missing during breakout.
---
🔍 **Pattern Observed:**
The chart highlights a **rectangle range breakout** or a **horizontal consolidation breakout**. Price was consolidating between \~₹4,670 and ₹5,750 levels for several weeks and has now broken out above ₹5,750, confirming the breakout.
---
🔹 **Key Levels:**
* **Breakout zone:** ₹5,750
* **Current price:** \~₹5,913.50
* **Next resistance/target:** Measured move target around ₹6,847–₹6,900 based on the height of the rectangle (₹1,083.55 added to the breakout point).
* **Support:** ₹5,750–₹5,600 zone.
---
🔹 **Volume is missing during breakout.
Disclaimer
The information and publications are not meant to be, and do not constitute, financial, investment, trading, or other types of advice or recommendations supplied or endorsed by TradingView. Read more in the Terms of Use.
Disclaimer
The information and publications are not meant to be, and do not constitute, financial, investment, trading, or other types of advice or recommendations supplied or endorsed by TradingView. Read more in the Terms of Use.