Vedanta Limited is experiencing a major technical breakout, surpassing its previous lifetime high from 2010, with strong RSI momentum signaling bullish strength.
📈 Vedanta Limited: A Technical Breakout After 15 Years
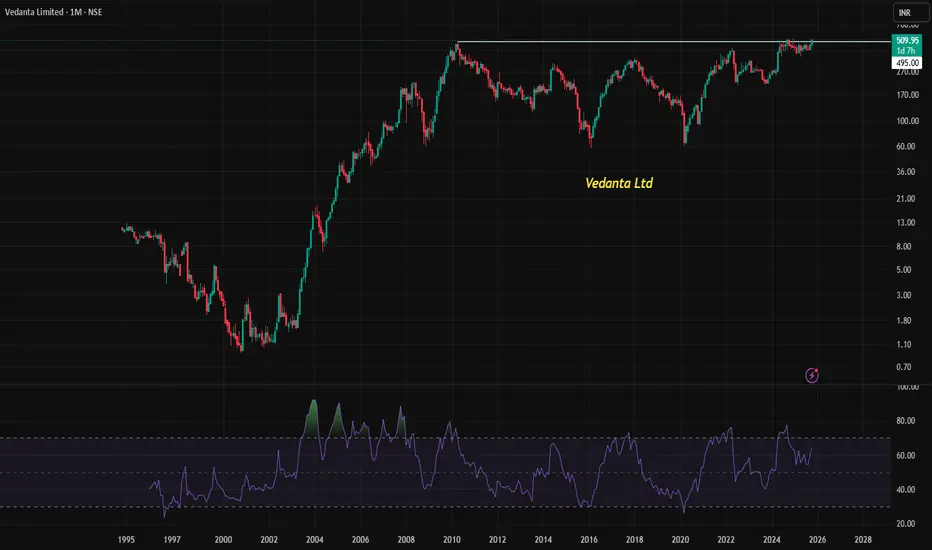
Vedanta Limited (NSE: VEDL), a major player in the metals and mining sector, is currently trading around ₹513. This marks a significant milestone, as the stock has broken above its previous lifetime high set in 2010, signaling a long-awaited technical breakout. Such a move is often seen as a strong bullish indicator, especially when supported by other technical metrics.
🔍 What Is a Breakout?
A breakout occurs when a stock moves above a defined resistance level—typically a previous high—on increased volume and momentum. In Vedanta’s case, the resistance was its 2010 peak, which has now been decisively breached. This suggests renewed investor confidence and potential for further upside.
📊 RSI Momentum: A Bullish Signal
The Relative Strength Index (RSI) is a momentum oscillator that measures the speed and change of price movements. It ranges from 0 to 100, with readings above 50 generally indicating bullish momentum. Vedanta’s RSI is currently hovering between 50 and 70, with recent readings around 69.91, placing it firmly in the uptrend zone. This suggests that the stock is gaining strength but hasn't yet entered the overbought territory (above 70), which could mean there's still room for growth.
🧭 Moving Averages Support the Trend
Vedanta’s price is also trading above key moving averages:
50-day SMA: ₹454.8
200-day SMA: ₹441.52
Trading above these averages confirms the bullish trend and adds further credibility to the breakout.
📌 Why This Matters
Long-term breakout: Surpassing a 15-year high is rare and often leads to sustained rallies.
Strong technical indicators: RSI, SMA, and other oscillators are aligned in favor of bulls.
Sector momentum: The metals and mining sector has seen renewed interest, adding tailwinds to Vedanta’s move.
🧠 Investor Takeaway
Vedanta’s breakout above its 2010 high is not just a chart anomaly—it’s a signal of potential long-term trend reversal. With RSI in a healthy range and price action supported by moving averages, technical analysts may view this as a strong buy zone. However, as always, investors should consider broader market conditions and fundamental factors before making decisions.
Live chart Example
📈 Vedanta Limited: A Technical Breakout After 15 Years
Vedanta Limited (NSE: VEDL), a major player in the metals and mining sector, is currently trading around ₹513. This marks a significant milestone, as the stock has broken above its previous lifetime high set in 2010, signaling a long-awaited technical breakout. Such a move is often seen as a strong bullish indicator, especially when supported by other technical metrics.
🔍 What Is a Breakout?
A breakout occurs when a stock moves above a defined resistance level—typically a previous high—on increased volume and momentum. In Vedanta’s case, the resistance was its 2010 peak, which has now been decisively breached. This suggests renewed investor confidence and potential for further upside.
📊 RSI Momentum: A Bullish Signal
The Relative Strength Index (RSI) is a momentum oscillator that measures the speed and change of price movements. It ranges from 0 to 100, with readings above 50 generally indicating bullish momentum. Vedanta’s RSI is currently hovering between 50 and 70, with recent readings around 69.91, placing it firmly in the uptrend zone. This suggests that the stock is gaining strength but hasn't yet entered the overbought territory (above 70), which could mean there's still room for growth.
🧭 Moving Averages Support the Trend
Vedanta’s price is also trading above key moving averages:
50-day SMA: ₹454.8
200-day SMA: ₹441.52
Trading above these averages confirms the bullish trend and adds further credibility to the breakout.
📌 Why This Matters
Long-term breakout: Surpassing a 15-year high is rare and often leads to sustained rallies.
Strong technical indicators: RSI, SMA, and other oscillators are aligned in favor of bulls.
Sector momentum: The metals and mining sector has seen renewed interest, adding tailwinds to Vedanta’s move.
🧠 Investor Takeaway
Vedanta’s breakout above its 2010 high is not just a chart anomaly—it’s a signal of potential long-term trend reversal. With RSI in a healthy range and price action supported by moving averages, technical analysts may view this as a strong buy zone. However, as always, investors should consider broader market conditions and fundamental factors before making decisions.
Live chart Example
Disclaimer
The information and publications are not meant to be, and do not constitute, financial, investment, trading, or other types of advice or recommendations supplied or endorsed by TradingView. Read more in the Terms of Use.
Disclaimer
The information and publications are not meant to be, and do not constitute, financial, investment, trading, or other types of advice or recommendations supplied or endorsed by TradingView. Read more in the Terms of Use.