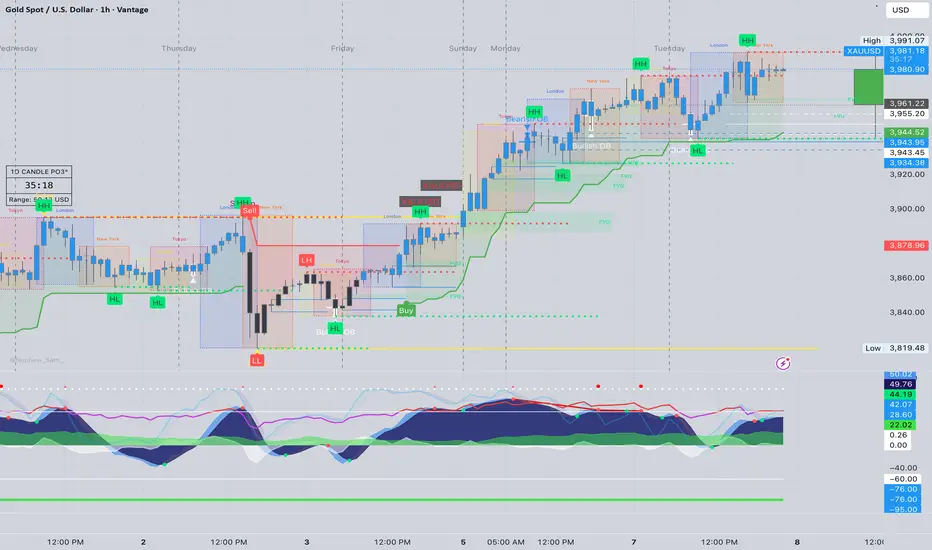
Gold closed the US session around 3,981, consolidating within a narrow range after a strong impulsive move from 3,946 → 3,991.
The pair continues to show bullish structure on all major timeframes, but with signs of momentum fatigue at current highs.
Asian session likely to provide either a minor correction or accumulation phase before next directional move during London.
⸻
📊 1️⃣ DAILY TIMEFRAME (D1)
• Structure: Strong bullish continuation since breaking out above 3,866 (last week’s BOS).
• EMAs: Price trading well above the 20 EMA (3,918) and 50 EMA (3,837) → showing strong trend control by buyers.
• RSI: 77 → overbought, risk of a short-term correction before further upside.
• Parabolic SAR: Still below price, confirming uptrend intact.
• Immediate resistance: 3,991–4,000 (psychological zone)
• Key support: 3,918–3,914
🔹 Bias: Trend remains bullish, but watch for exhaustion near 4,000. A corrective pullback toward 3,965–3,940 would be healthy for continuation.
⸻
📉 2️⃣ 1H TIMEFRAME (H1)
• Price trading in a rising channel, currently at upper boundary (~3,981).
• Previous BOS confirmed at 3,965, turning that area into dynamic support.
• EMAs 20/50 (3,970–3,961) acting as intraday support band.
• MACD histogram slightly fading → momentum cooling, but still positive.
• RSI 64 → neutral, providing space for another push higher if buyers defend supports.
• Structure forming potential ascending triangle → breakout may target 3,991 → 4,000 zone.
🔹 Bias: Bullish above 3,961, neutral between 3,961–3,946, bearish only below 3,946.
⸻
⏱ 3️⃣ 15M TIMEFRAME (M15)
• Clear liquidity sweep below 3,961 earlier, followed by a Change of Character (CHoCH) to bullish.
• Price forming higher lows, consolidating between 3,977–3,982 → tight compression before breakout.
• MACD recovering from minor bearish phase, RSI 58 → modest bullish pressure.
• EMAs crossing upward again, aligning with structure support at 3,973–3,970.
🔹 Expect accumulation within 3,973–3,982 before breakout confirmation.
⸻
📈 4️⃣ 5M TIMEFRAME (M5 – Scalping Focus)
• Micro-structure: short-term consolidation with support at 3,970 and resistance at 3,983.
• Momentum: MACD showing flattening histogram, RSI neutral (~52) → potential low-volume Asian range.
• EMAs flatlining → ideal setup for scalpers awaiting breakout or pullback to golden zone.
⸻
✨ FIBONACCI GOLDEN ZONE (SHORT-TERM)
Measured from 3,946 (swing low) → 3,991 (swing high):
• 38.2% = 3,974
• 50% = 3,968
• 61.8% = 3,962
🔸 This forms the Golden Zone = 3,974–3,962 — high-probability buy reaction area if tested.
Aligns with trendline + EMA support, increasing confluence.
⸻
🚨 BREAKOUT LEVELS TO WATCH
Direction Breakout Zone Retest Confirmation Target Zones
Bullish Above 3,983–3,985 Retest 3,980–3,982 3,991 → 4,000 → 4,015
Bearish Below 3,961–3,958 Retest 3,962–3,965 3,946 → 3,940 → 3,927
⸻
🧭 ASIAN SESSION OUTLOOK
• Base Case (60% probability):
Sideways-to-slightly bullish consolidation above 3,970 ahead of London volatility.
Price likely to respect Golden Zone (3,974–3,962) before continuation.
• Alternative (30% probability):
Brief dip into 3,958–3,946 liquidity pocket before strong bounce upward.
• Low Probability (10%):
Sustained bearish breakdown below 3,946, invalidating intraday uptrend.
⸻
📊 SUMMARY
• Gold remains in a strong bullish uptrend, consolidating near the top of the channel.
• 3,974–3,962 (Golden Zone) remains key area for buyers to defend.
• Breakout above 3,985 will confirm continuation toward 4,000–4,015.
• Only a confirmed drop below 3,946 shifts structure bearish short term.
Bias for Asian Session:
🟢 Bullish above 3,962
⚪ Neutral between 3,962–3,946
🔴 Bearish below 3,946
⸻
🟡 Conclusion:
Expect calm range trading during Asia with bullish continuation probability if 3,970–3,962 holds.
Aggressive moves likely resume in London session.
Overall structure and indicators favor dip accumulation rather than shorting.
⸻
— ElDoradoFx PREMIUM 3.0 Team 🚀
Disclaimer
The information and publications are not meant to be, and do not constitute, financial, investment, trading, or other types of advice or recommendations supplied or endorsed by TradingView. Read more in the Terms of Use.
— ElDoradoFx PREMIUM 3.0 Team 🚀
Disclaimer
The information and publications are not meant to be, and do not constitute, financial, investment, trading, or other types of advice or recommendations supplied or endorsed by TradingView. Read more in the Terms of Use.