Gold's wide-range fluctuation cycle is expected to continue, with the daily chart showing cyclical ups and downs. Prices are adjusting around the RSI indicator's midline, and the 10-day and 7-day moving averages are closely aligned, currently near the 5-day moving average. The 4-hour chart shows the Bollinger Bands narrowing, with prices consolidating within the lower half of the band. The hourly RSI indicator is consolidating around 50. Gold is expected to maintain a wide range of fluctuations, and the larger-cycle downward correction is not yet over.
Gold rebounded yesterday during the US session, reaching a high near 3990. This rebound has brought the price back into the trading range, but it doesn't negate our strategy of selling on rallies. Gold is currently under pressure below the 4000 level, with short-term bears holding the upper hand. The 4000 level has become a key dividing line between bulls and bears; as long as it is not broken, the downtrend will continue.
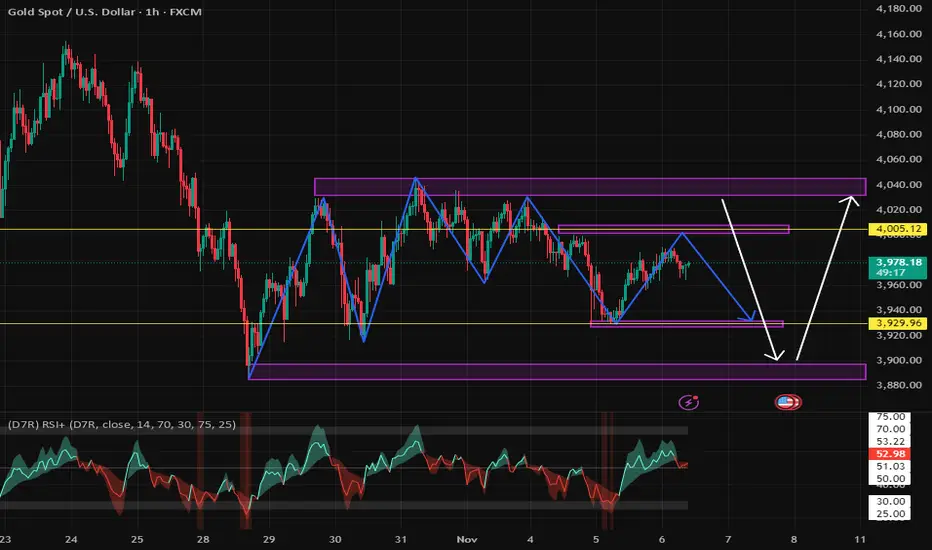
The 1-hour chart for gold remains in a weak, oscillating pattern. The current market is characterized by large swings, but no clear trend. Yesterday's ADP report did not cause significant volatility in gold, so we expect continued consolidation. We will sell at resistance levels.
Key Levels:
First Support: 3958, Second Support: 3930, Third Support: 3912
First Resistance: 3988, Second Resistance: 4005, Third Resistance: 4028
Gold Intraday Trading Strategy:
Buy: 3925-3930, SL: 3915, TP: 3950-3960;
Sell: 4000-4005, SL: 4015, TP: 3980-3970;
More Analysis →
Gold rebounded yesterday during the US session, reaching a high near 3990. This rebound has brought the price back into the trading range, but it doesn't negate our strategy of selling on rallies. Gold is currently under pressure below the 4000 level, with short-term bears holding the upper hand. The 4000 level has become a key dividing line between bulls and bears; as long as it is not broken, the downtrend will continue.
The 1-hour chart for gold remains in a weak, oscillating pattern. The current market is characterized by large swings, but no clear trend. Yesterday's ADP report did not cause significant volatility in gold, so we expect continued consolidation. We will sell at resistance levels.
Key Levels:
First Support: 3958, Second Support: 3930, Third Support: 3912
First Resistance: 3988, Second Resistance: 4005, Third Resistance: 4028
Gold Intraday Trading Strategy:
Buy: 3925-3930, SL: 3915, TP: 3950-3960;
Sell: 4000-4005, SL: 4015, TP: 3980-3970;
More Analysis →
More free daily updates of signals and analysis
✅Gold Trading Knowledge Camp
💥Welcome to my Telegram channel: t.me/JungoldAnalyst
✅Gold Trading Knowledge Camp
💥Welcome to my Telegram channel: t.me/JungoldAnalyst
Disclaimer
The information and publications are not meant to be, and do not constitute, financial, investment, trading, or other types of advice or recommendations supplied or endorsed by TradingView. Read more in the Terms of Use.