
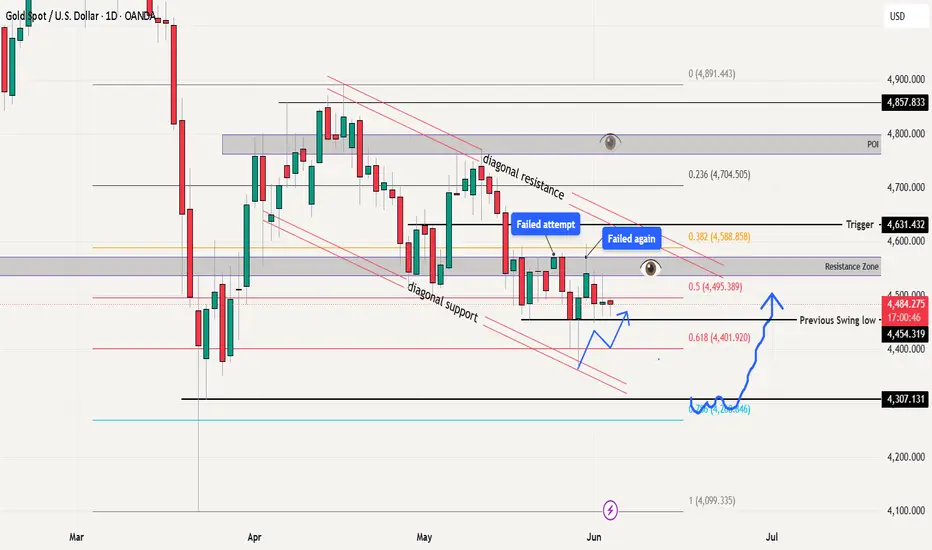
Gold continues to drift inside the narrow range without conviction in either direction. Today's bias remains unchanged from yesterday's analysis. The structure is clear: rejection at $4,550-70 resistance zone confirmed multiple times, and the previous swing low at $4,454 holding as the floor for now. Volume is thin. Headlines are competing. Price is consolidating.
What happened in the last 24 hours:
Gold climbed back above $4,500 on Tuesday after Monday's drop, recovering as a pullback in oil prices helped temper inflation concerns. But the bounce faded into Asian session today and we are back at $4,484.
Iranian media reported Tehran suspended communications with Washington in response to Israeli attacks in Lebanon. Trump said talks are still ongoing and indicated a memorandum of understanding with Iran to reopen the Strait of Hormuz could be reached "as soon as next week." Same on-again off-again headlines.
The 10-year Treasury yield is holding near the 4.5% area. The dollar remains firm enough to keep gold capped below the $4,550 to $4,576 resistance zone. Money markets price in nearly 68% chance of a Fed rate hike toward end of 2026.
Friday is NFP. The week is loaded with potential catalysts but none today are typically gold movers unless they surprise dramatically.
4-Hour Chart -- AsliGold S/R Reading:
The 4H view adds critical confirmation to the daily structure. The AG_SR system is showing:
Current Price: $4,484
Nearest Resistance: $4,505 (Strength rating x7) - this is significant
Nearest Support: $4,436 (Strength rating x17) - this is very strong support
ATR: 33.3
HTF Trend: UP (Daily)
Key zones from the 4H:
$4,654 (x12 strength) - heavy supply zone above
$4,505 (x7) - nearest resistance, currently capping price
$4,436 (x17) - nearest support, very strong demand
$4,222 (x11) - major demand zone deep below
The 17-rating strength at $4,436 is the strongest level on the 4H chart. That tells you institutional buyers have been defending this area aggressively. The 7-rating at $4,505 explains why every bounce gets sold there.
The setup is tight:
Daily chart: range between $4,494 (0.5 Fib) and $4,540 (within resistance zone). Below $4,454 opens further decline.
4H chart: range between $4,436 (x17 support) and $4,505 (x7 resistance). Today's price action is happening between these two zones.
The convergence of daily and 4H levels is important. The $4,436-$4,454 area is where multiple structural supports meet. The $4,505-$4,540 area is where multiple resistances cluster.
Iran headlines remain unpredictable. The Trump "next week MoU" statement is the kind of headline that can move price 1% in either direction depending on whether the market believes it this time.
The trade:
Inside the$4,454 vs $4,554.range, this is a chop zone. No directional edge until one of these levels breaks on a closing basis. The strong 4H support at $4,436 plus the daily swing low at $4,454 create a 18-dollar buffer zone. Below $4,436 the structure damages significantly.
Above $4,505 on the close, the path opens toward $4,540 and the resistance zone. Above $4,540 close, the trigger at $4,631 comes into view.
current bias is corrective even if we see bounce for short term .We need to wait for lower levels to test or need breakout in higher side.

Related publications
Disclaimer
The information and publications are not meant to be, and do not constitute, financial, investment, trading, or other types of advice or recommendations supplied or endorsed by TradingView. Read more in the Terms of Use.
Related publications
Disclaimer
The information and publications are not meant to be, and do not constitute, financial, investment, trading, or other types of advice or recommendations supplied or endorsed by TradingView. Read more in the Terms of Use.