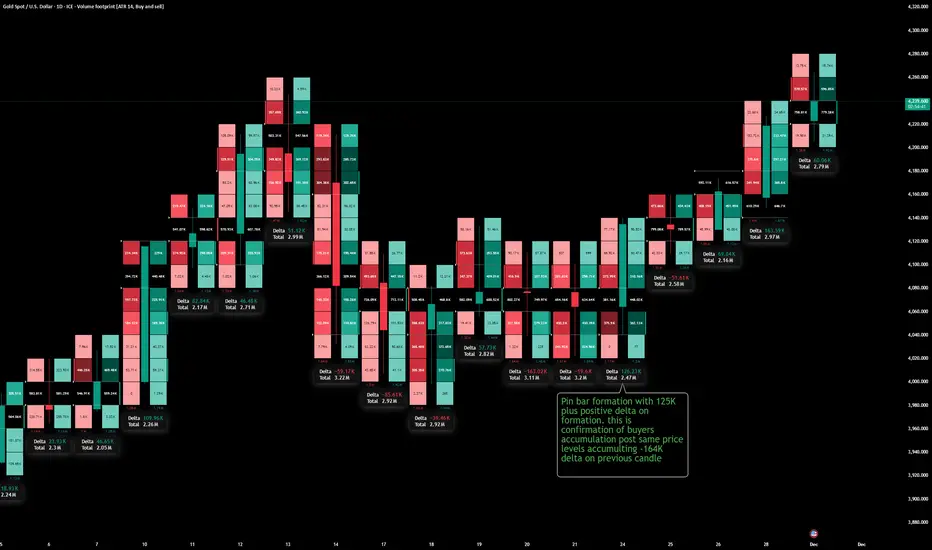
This footprint shows aggressive sellers getting absorbed, then buyers stepping in and reversing the auction, confirmed by a change in delta and a bullish pin bar structure.
What delta is showing
- Each candle’s delta is buy volume minus sell volume, so negative delta = aggressive selling at the bid, and positive delta = aggressive buying at the offer.
- When you see a series of candles with heavy negative delta at similar prices but price is not breaking lower, it often means sellers are getting absorbed by passive buy limits sitting in the book.
Reading your highlighted zone
- The previous candle has a strongly negative delta (around −164K), meaning aggressive sellers hit the bid hard at those same price levels but could not push the market down much further, which hints at seller exhaustion or absorption.
- The next candle forms a pin bar with a long lower wick and flips to a solid positive delta (around +125K), meaning that after sellers tried again at the lows, aggressive buyers lifted the offer and reclaimed the range, trapping late shorts in the wick.
Logical order‑flow narrative
- Step 1: Into the low, repeated negative delta shows traders selling aggressively, but the lack of fresh lows means big passive buyers are absorbing that flow at the bid (large negative delta, small net progress in price).
- Step 2: On the pin bar candle, sellers again attack the same prices, but this time buyers respond even more aggressively, flipping delta positive and bidding price back above the prior traded cluster – that’s buyer accumulation at the same levels where sellers just loaded up.
- Step 3: Once price lifts, those trapped sellers must buy back to exit, adding fuel to the upside; the following candles keep printing higher with mostly positive or improving delta, confirming that control has shifted to buyers and the move is likely to continue.
How to trade this logic
- Treat “big negative delta at lows + no breakdown” as a potential trap/absorption zone, then look for the next candle to show a clear rejection wick plus a decisive flip to positive delta as entry confirmation for longs.
- Manage risk just below the pin bar low (where sellers failed), and only stay in the trade while subsequent footprints keep showing supportive or at least non‑bearish delta; if price makes new highs on weakening or negative delta, start expecting profit‑taking or a possible stall.
Disclaimer
The information and publications are not meant to be, and do not constitute, financial, investment, trading, or other types of advice or recommendations supplied or endorsed by TradingView. Read more in the Terms of Use.
Disclaimer
The information and publications are not meant to be, and do not constitute, financial, investment, trading, or other types of advice or recommendations supplied or endorsed by TradingView. Read more in the Terms of Use.