
Hello, traders! 👋
Hope your trading is going well! 🚀
Looking at the 4-hour chart, gold has entered a fairly clear corrective rebound phase. Price has moved back above the MA5, MA10, and MA20, while also reclaiming the Bollinger Band midline, which suggests that short-term bullish momentum is recovering. However, at this stage, I still prefer to view this move as a technical rebound following the sharp sell-off rather than a confirmed trend reversal.
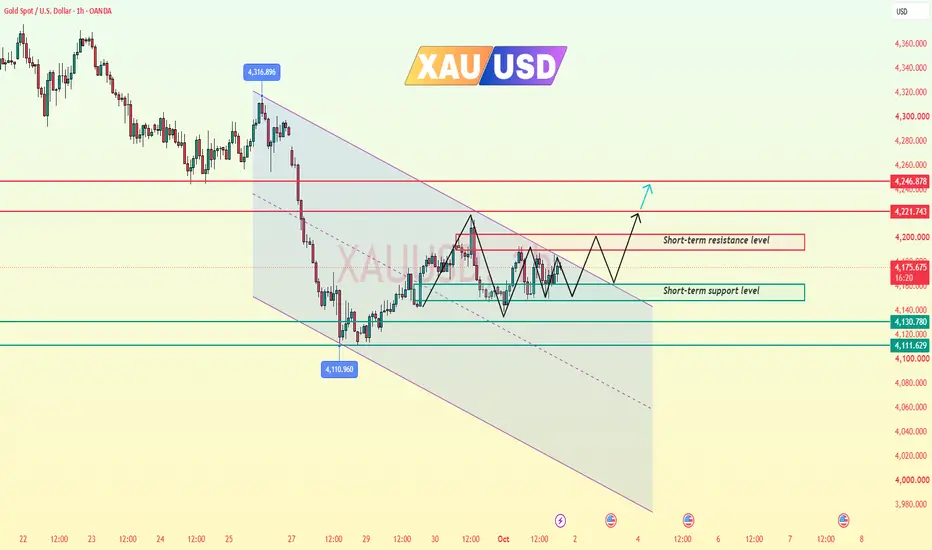
On the upside, the key resistance area to watch is 4199–4202. If gold can establish a solid 4-hour close above 4202, the rebound could extend further, with 4246 and even 4273 becoming the next upside targets. On the downside, 4174 and 4160 are the key levels to monitor. As long as 4160 is not decisively broken, the current short-term rebound structure remains intact.
Turning to the 1-hour chart, the short-term structure is noticeably stronger than on the 4-hour timeframe. Price has moved back above the short-term moving averages, with the MA5, MA10, and MA20 clustered around 4169–4172, creating a certain degree of support. At the same time, recent lows have been gradually rising, suggesting that buyers are still trying to push the market higher. However, 4192–4202 remains the most important resistance zone, and only a breakout above this area would open the way for a further test of 4219.
In terms of trading strategy, the preferred setup is to watch for buying opportunities if price pulls back into the 4168–4174 area and holds firmly. If gold breaks directly above 4202 and then confirms the breakout on a successful retest, following the move higher may also be considered. On the other hand, if price falls below 4160 and fails to recover quickly, the current rebound structure would weaken significantly, with downside risk returning toward 4146, 4130, and potentially 4110.
👉 If you found this analysis helpful, please leave a like and share your thoughts in the comments!
❤️ Wishing you successful trading!
Trade active
From the 4-hour chart, gold is currently in a clear corrective rebound phase. Price has moved back above the MA5, MA10, and MA20, while the short-term moving averages are beginning to turn higher, suggesting that bearish momentum is weakening. However, the 4195–4200 area remains a key resistance zone, as it aligns with both the upper Bollinger Band and the first major resistance level. For now, the broader structure is better described as a rebound from the lows with a mildly bullish bias, rather than a confirmed 4-hour trend reversal. A decisive break above 4200, followed by a sustained move above 4223, would provide stronger confirmation that the trend is shifting in favor of the bulls.On the 1-hour chart, the short-term structure is relatively stronger. Price is trading above the Bollinger mid-band, as well as the MA10 and MA20, indicating that buyers currently have the upper hand. That said, gold is now approaching the 4195–4200 resistance zone, and the recent pullback after several upside attempts suggests noticeable selling pressure in this area. As long as price holds above 4170–4175, the short-term outlook remains range-bound with a bullish bias. A break below 4169 would weaken the structure and shift attention toward the 4146–4153 support zone.
In terms of trading strategy, chasing long positions near resistance is not ideal at this stage. A more favorable bullish setup would be to wait for a pullback toward 4170 and look for signs of stabilization before considering long exposure, with 4195–4200 as the first upside target. If the 1-hour chart produces a solid breakout above 4200 and price successfully retests and holds that level, the next area to watch would be around 4223.
For the bearish scenario, the main focus is whether gold once again encounters strong resistance around 4200. If repeated attempts to break higher fail and the 1-hour chart shows clear signs of weakness, a pullback toward 4175 or even 4150 could follow. If price subsequently breaks below 4146, it would indicate that the current rebound structure has been materially damaged, increasing the likelihood that sellers regain control.
Trade closed: target reached
Congratulations to the traders who followed our trading strategy. The long positions have reached a high of around 4,226. 👏👏👏
✅ Professional Gold Trading Analysis | XAUUSD
✅ Daily market analysis, key support & resistance levels, and practical trading setups based on technical structure and price action.
✅ Trade with a plan. Manage risk.
🌐: t.me/+FpaizTnv2bRmNzk1
✅ Daily market analysis, key support & resistance levels, and practical trading setups based on technical structure and price action.
✅ Trade with a plan. Manage risk.
🌐: t.me/+FpaizTnv2bRmNzk1
Disclaimer
The information and publications are not meant to be, and do not constitute, financial, investment, trading, or other types of advice or recommendations supplied or endorsed by TradingView. Read more in the Terms of Use.