
MARKET ANALYZ — DiscipleFx | October 2, 2026
XAUUSD • 1H Chart • Education/Demo Purpose Only
Market Structure
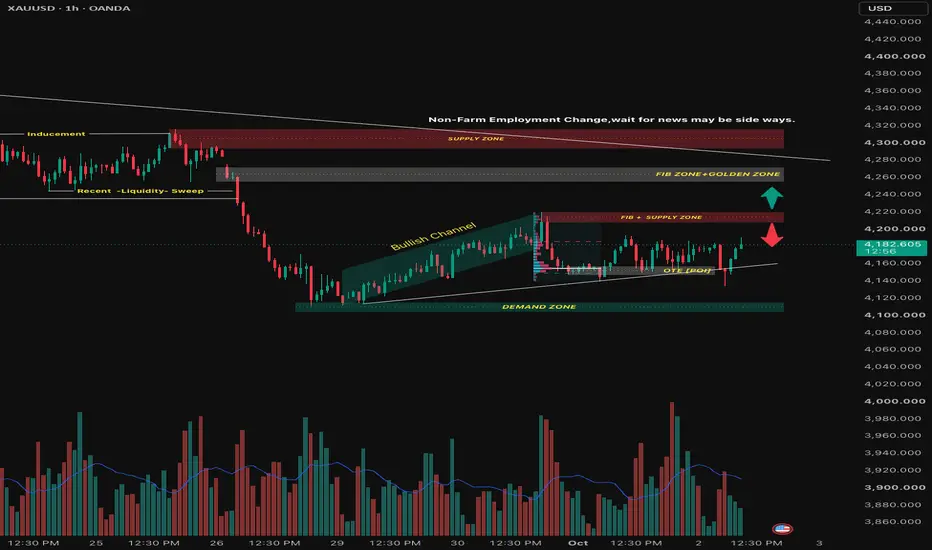
Current structure: RANGE → Slight Bearish bias
- Price is around 4188.95.
- The previous bullish channel has been broken.
- Price rejected the 4205–4220 supply zone.
- Until price breaks 4220 or 4145, the market can remain choppy/ranging.
Key Support & Resistance
Resistance
4205–4220 — Major supply / rejection zone
4255–4270 — Fib + Golden Zone
4290–4315 — Higher supply zone
Support
4145–4160 — OTE / POI
4105–4125 — Major demand zone
Liquidity Zones
- Buy-side liquidity: Above 4205–4220
- Higher buy-side liquidity: Around 4255–4270
- Sell-side liquidity: Below 4145
- Major sell-side liquidity: Around 4105–4125
BOS / CHOCH / FVG / OB / Sweep
- BOS: Previous bullish movement formed a higher structure, but momentum weakened near 4205–4220.
- CHOCH: The break below the bullish channel suggests a short-term structure change.
- FVG/Imbalance: The 4145–4160 area is important for a possible reaction.
- Order Block / POI: 4145–4160 is the key reaction area visible on the chart.
- Liquidity Sweep: Earlier downside liquidity was swept near the lower structure before the bullish channel developed.
Possible BUY Setup
Conditional — wait for confirmation
Entry: 4155–4165
SL: 50–75 pips below entry
TP1: 4188
TP2: 4205
TP3: 4220+
Look for a liquidity sweep + bullish rejection/BOS around 4145–4160 before entering.
Possible SELL Setup
Conditional — wait for rejection
Entry: 4205–4220
SL: 50–75 pips above entry
TP1: 4188
TP2: 4160
TP3: 4145
A strong rejection from 4205–4220 would support the short scenario.
Important: On XAUUSD, pip definitions vary by broker/platform. If your platform treats 1 pip as $0.01, 50–75 pips = $0.50–$0.75. A stop beyond the full structure zone may require more distance.
Risk : Reward
- Buy: approximately 1:2 to 1:4+, depending on entry and confirmation.
- Sell: approximately 1:2 to 1:4, depending on entry.
- Don't enter simply because price touches a zone; wait for confirmation.
Visible-Chart Probability
Bullish: ~45%
Bearish: ~55%
This is a chart-based scenario estimate, not a statistical prediction.
Retail Trap Areas ⚠️
- Buying directly underneath 4205–4220 supply.
- Selling directly above 4145–4160 support.
- Chasing a breakout without confirmation.
- Entering during the NFP/news period shown on your chart.
Beginner Explanation
Think of the chart as a box:
4205–4220 = ceiling 🔴
4145–4160 = floor 🟢
If price reaches the ceiling and gets rejected → watch for SELL.
If price reaches the floor and gives bullish confirmation → watch for BUY.
A clean break and retest of either area can change the setup.
FINAL VERDICT
WAIT — Confidence: 60%
Current price around 4189 is between the major zones, so chasing a trade here gives less favorable structure.
Bullish trigger: sustained break/retest above 4220.
Bearish trigger: sustained break below 4145.
Education only — use a demo account and manage risk carefully.
If price stays above 4160, my bias remains cautiously bullish; if price stays below 4145, my bias remains bearish.

Disclaimer
The information and publications are not meant to be, and do not constitute, financial, investment, trading, or other types of advice or recommendations supplied or endorsed by TradingView. Read more in the Terms of Use.
Disclaimer
The information and publications are not meant to be, and do not constitute, financial, investment, trading, or other types of advice or recommendations supplied or endorsed by TradingView. Read more in the Terms of Use.