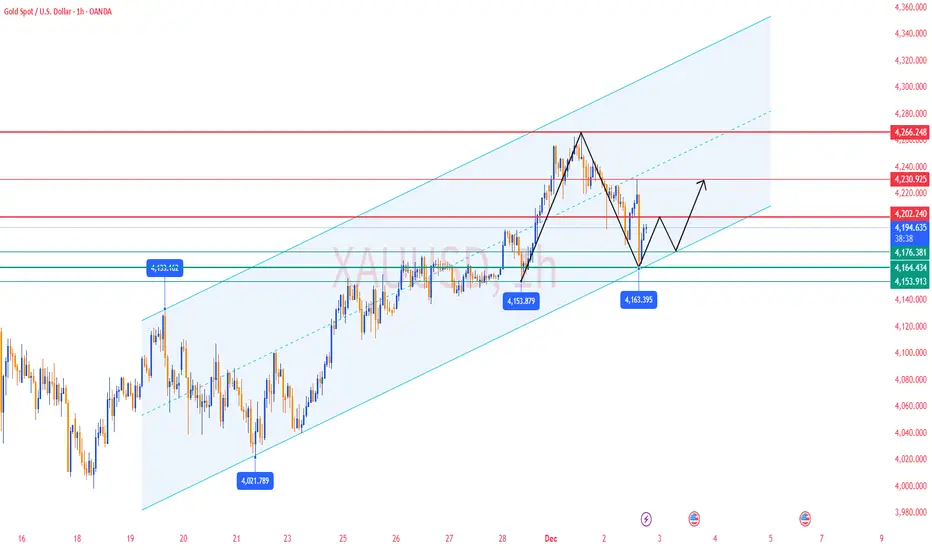
✅ During today’s U.S. session, gold dipped to a low of 4163 and then strongly rebounded to around 4195.
➡️ This indicates two key points:
1️⃣ 4163 has been confirmed as the short-term bottom of this downward move (strong support validated)
2️⃣ Buyers absorbed positions near the key support zone → rebound momentum is recovering
Gold has shifted from a “sharp decline / weak structure” into a “bottoming rebound pattern.”
✅ 4H Chart (H4) Trend Analysis
1️⃣ Signs of the high-level correction coming to an end
Gold corrected down from the 4264 high and reached a low of 4163.
The latest H4 candle shows a long lower wick, reflecting strong buying pressure and indicating that bulls have begun to defend.
2️⃣ Bollinger Bands Structure
Price has rebounded from below the middle band back above it → short-term bearish pressure is easing
Lower band at 4143 was not touched
Middle band (≈4202) is currently the key resistance & reversal level
➡️ If gold reclaims the Bollinger middle band at 4202, H4 will return to a strong bullish rhythm.
3️⃣ Moving Averages
MA5 and MA10 are pointing downward → short-term correction continues
But MA20 (≈4200–4202) is still sloping upward → the medium-term bullish structure remains intact
Current price is right under the MA20 resistance zone
➡️ 4200–4202 = the key reversal confirmation level for H4.
✅ 1H Chart (H1) Trend Analysis
1️⃣ Downtrend channel interrupted by a “strong lower wick”
Gold printed a significant lower shadow at 4163, signaling a classic “bottoming rejection.”
2️⃣ Moving Averages
Price has moved back above MA5 and MA10 → bearish momentum weakening
MA20 (≈4210) is still capping the rebound
➡️ A break above MA20 would flip H1 back into a bullish short-term structure.
3️⃣ Bollinger Bands Structure
Lower band (≈4176) was tested and price bounced sharply → strong support
Middle band (≈4210) is the short-term bullish breakout level
🔴 Resistance Levels: 4200–4202 / 4230–4234 / 4250–4256
🟢 Support Levels: 4185–4180 / 4175 / 4163
✅ Trading Strategy Reference
🔰 Main Strategy: Buy on Pullbacks (Trend intact, buy dips)
Current price around 4195 is part of the early rebound phase.
“Steady buyers” should watch two signals:
🔍 Signal 1: Ability to hold above 4202 (H4 reversal level)
🔍 Signal 2: Break above 4210 (H1 middle band)
🟠First Buy Zone: 4185–4180 (short-term support)
If price retests and holds, consider light long positions
🎯 Targets: 4205 / 4215 / 4234
⛔ Stop-loss: below 4170
🟠Second Buy Zone: 4175–4165 (strong support zone)
This area is the “institutional absorption zone.”
If tested again and holds, it becomes an excellent medium-term long entry.
🎯 Targets: 4205 / 4234 / 4250
⛔ Stop-loss: below 4155
🔰 Secondary Strategy: Short on Rejections (short-term only)
Even though price has rebounded, key resistance has not yet been broken, so shorting rejections remains a short-term strategy:
🟠First Sell Zone: 4202–4210
Short lightly if any of the following appear:
▪ Long upper wick
▪ Bearish 1H candle
▪ Weak breakout with low volume
🎯 Targets: 4185 / 4175
⛔ Stop-loss: above 4220
🟠Second Sell Zone: 4234–4250
(strong resistance, suitable for high-level shorts)
🎯 Targets: 4205 / 4180
⛔ Stop-loss: above 4262
✅ Trend Summary
1️⃣ 4163 = confirmed short-term bottom of this correction
2️⃣ Gold is currently in a bottoming rebound structure
3️⃣ 4202–4210 = must-break resistance zone for short-term bulls
4️⃣ Break above 4210 → gold turns strong again, targeting 4234 / 4250
5️⃣ Break below 4175 → gold may retest 4163, or even drop toward 4150
6️⃣ Medium-term bullish structure remains intact; the market has only completed a necessary technical correction
✅ 𝐃𝐚𝐢𝐥𝐲 𝟐-𝟒 𝐓𝐫𝐚𝐝𝐢𝐧𝐠 𝐒𝐢𝐠𝐧𝐚𝐥𝐬 🔥
✅ 𝐇𝐢𝐠𝐡 𝐀𝐜𝐜𝐮𝐫𝐚𝐜𝐲 𝟗𝟎%-𝟗𝟓% 🔥
✅ 𝐌𝐨𝐧𝐭𝐡𝐥𝐲 𝐏𝐫𝐨𝐟𝐢𝐭 𝟑𝟓𝟎𝟎 𝐏𝐈𝐏𝐒 🔥
💎 𝐏𝐫𝐨𝐟𝐞𝐬𝐬𝐢𝐨𝐧𝐚𝐥 𝐅𝐫𝐞𝐞 𝐆𝐫𝐨𝐮𝐩:t.me/+YgFaky2XQ7ViYWE9
✅ 𝐇𝐢𝐠𝐡 𝐀𝐜𝐜𝐮𝐫𝐚𝐜𝐲 𝟗𝟎%-𝟗𝟓% 🔥
✅ 𝐌𝐨𝐧𝐭𝐡𝐥𝐲 𝐏𝐫𝐨𝐟𝐢𝐭 𝟑𝟓𝟎𝟎 𝐏𝐈𝐏𝐒 🔥
💎 𝐏𝐫𝐨𝐟𝐞𝐬𝐬𝐢𝐨𝐧𝐚𝐥 𝐅𝐫𝐞𝐞 𝐆𝐫𝐨𝐮𝐩:t.me/+YgFaky2XQ7ViYWE9
Disclaimer
The information and publications are not meant to be, and do not constitute, financial, investment, trading, or other types of advice or recommendations supplied or endorsed by TradingView. Read more in the Terms of Use.