
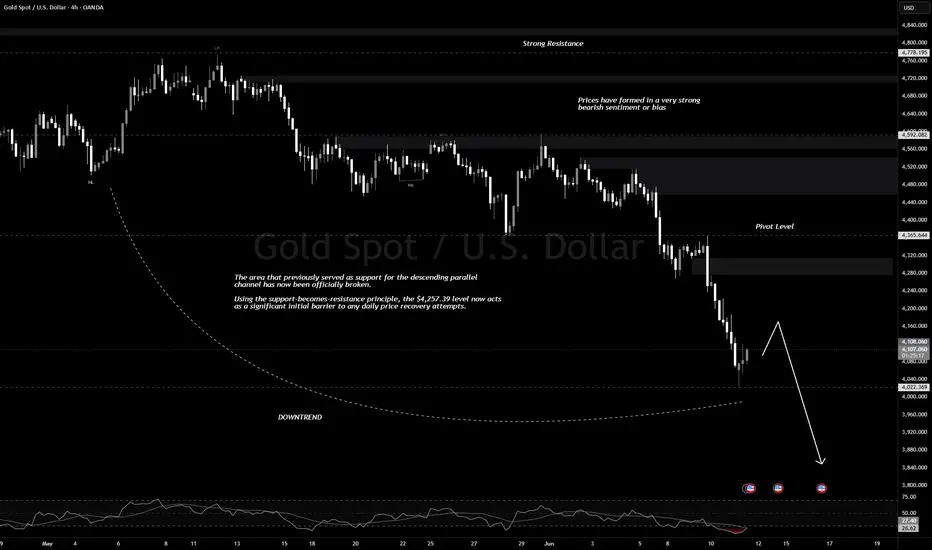
Global financial markets have officially entered a highly volatile geopolitical and monetary emergency phase. Gold prices (XAU/USD) recorded a modest recovery (short-covering) during the Asian session, but struggled to climb and remained stuck below the psychological level of $4,100.
This bullion commodity is near its lowest level since November 2025 due to the twin shocks of the total blockade of the Strait of Hormuz and a jump in US headline inflation to a three-year high.
-----------------------------------------------------------------------------------------------------
✅ Macroeconomics: CPI Anomaly (Benign Core vs. 4.2% Headline Explosion)
The release of US Consumer Price Index (CPI) data last night provided mixed signals that were responded to aggressively by the bond market:
- ⚡Core CPI Declines: The US Department of Labor reported that the monthly Core CPI (excluding food & energy) fell to 0.2% month-on-month (vs. 0.4% the previous month), bringing the annual rate to 2.9% year-on-year (in line with expectations). This decline triggered an immediate weakening of the US dollar and prompted short-covering in gold.
- ⚡General CPI Skyrockets: On the other hand, the General CPI actually exploded from 3.8% to 4.2% YoY, setting a three-year record. This horrific surge was triggered solely by a 23.5% increase in energy costs due to the prolonged maritime war.
- ⚡FedWatch's Hawkish Verdict: The stubborn persistence of upstream inflation has forced market participants to lock in a 70% chance that the Federal Reserve will raise its benchmark interest rate in the remainder of 2026. Solid US Treasury yields benefit the US Dollar (USD) and undermine the appeal of gold (a non-interest-bearing asset).
-----------------------------------------------------------------------------------------------------
✅ Macro Technical Analysis: Perfect Bearish Technical Confirmation & Oversold Signal (RSI)
Technically, gold's price action has now validated massive structural damage. The decline has broken not one, but two major long-term defenses at once, handing absolute control to the bears.
- ⚡New Dynamic Wall ($4,257.39): The area that previously served as the support floor of the descending parallel channel has now been officially broken. Following the principle of support-becomes-resistance, the $4,257.39 level now acts as a very strong initial barrier to any daily price recovery attempts.
- ⚡Major Trend Filter ($4,446.37): The 200-day simple moving average (SMA), perched at $4,446.37, is now well above the current price. As long as gold trades below this anchor line, the long-term structural bias is purely bearish.
- ⚡Major Channel Roof ($4,572.06): The top of the daily descending channel is at this level, serving as the final boundary between an upward correction and a pure trend reversal. As long as the price is below this level, any upside is merely a corrective ripple.

Related publications
Disclaimer
The information and publications are not meant to be, and do not constitute, financial, investment, trading, or other types of advice or recommendations supplied or endorsed by TradingView. Read more in the Terms of Use.
Related publications
Disclaimer
The information and publications are not meant to be, and do not constitute, financial, investment, trading, or other types of advice or recommendations supplied or endorsed by TradingView. Read more in the Terms of Use.