
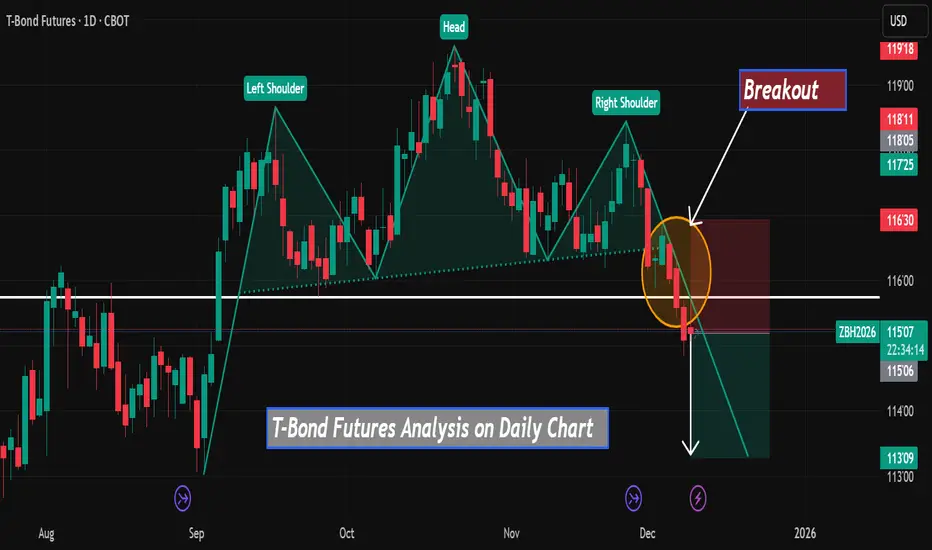
According to my analysis on the daily chart of T-Bond futures, there is a high probability of a decline toward the 113 level in the coming days.
This bearish outlook is supported by two main technical elements:
-A clear Head and Shoulders reversal pattern, indicating a potential trend change.
-A confirmed breakout, as highlighted on the chart, which strengthens the likelihood of further downward movement.
This bearish outlook is supported by two main technical elements:
-A clear Head and Shoulders reversal pattern, indicating a potential trend change.
-A confirmed breakout, as highlighted on the chart, which strengthens the likelihood of further downward movement.
Trade closed: stop reached

Disclaimer
The information and publications are not meant to be, and do not constitute, financial, investment, trading, or other types of advice or recommendations supplied or endorsed by TradingView. Read more in the Terms of Use.
Disclaimer
The information and publications are not meant to be, and do not constitute, financial, investment, trading, or other types of advice or recommendations supplied or endorsed by TradingView. Read more in the Terms of Use.