Abbott india target 34000On weekly charts Abbott india is forming flag and pole pattern. Looks strong on technical charts till now.
Stop loss will be lower end of following flag channel on weekly closing basis.
Once the pattern breakout occurs. Following are the targets -
Target 1 - 31500
Target 2 - 32600
Target 3 - 34000
Don't fall in FOMO mode and wait.
Abbottindia

Abbott India: 28% Upside in few weeks (Read below)1. Abbott India has posted strong Q4 numbers signalling a good quarter for Pharma sector overall
2. The Nifty Pharma Index has shown a bounce back from 18400 levels today with potential to rally to 19200 or beyond to 20000 if other companies post strong results too in the coming days
3. Nifty 50 bounced back from 22000 levels too today
4. If both Nifty and Pharma Sector continues the rally, then Abbott is sure to achieve its target in coming days (rather quickly)
Technicals:
1. Abbott has created a rounding bottom pattern with neckline at 28500 and base at 25500. The target comes at 33500 based on the pattern. This gives an upside of about 28% from current price
2. The price have been rejected multiple times by the blue trendline. Watch for a clear break above this trendline (around 26400 levels). A strong close above this line will indicate a bullish move going forward
3. The price is above the 200D SMA (purple line) but below the 50D SMA (orange line)
4. Currently the price has broken above the 20D SMA although got rejected by the upper Bollinger band (green line and blue bands) during intraday hours
Strategy:
1. Look for a clear closing above the trendline with strong volumes in next trading sessions
2. Look for rally in both Nifty and Pharma sector
3. If all parameters match, take entry around 26400-26500 levels with stop loss around 25350

ABBOTINDIAABBOTINDIA-EQ
-Cup & Handle Pattern Breakout with Retest on Weekly Time Frame
-Flag Pole Breakout on Daily Time Frame
-Massive Volume Buildup
-Trading All Time High
Entry 🟢: Above 28280
Target 🎯: 30700, 32000 ++
Stop loss 🔴: 25000 WCB
Remark: Short Term
⚠️ Disclaimer : Chart & Levels are for educational purposes. Trade according to your Risk or consult with your Finance Advisor.

A bull move awaiting hereAbbott India formed a good flag and pole - with all factors necessary to anticipate bullish move.
Present price can be used for call option buying and even intraday cash trade can be taken.
Sector supports too, but as over all market is negative, be quick to book the profits

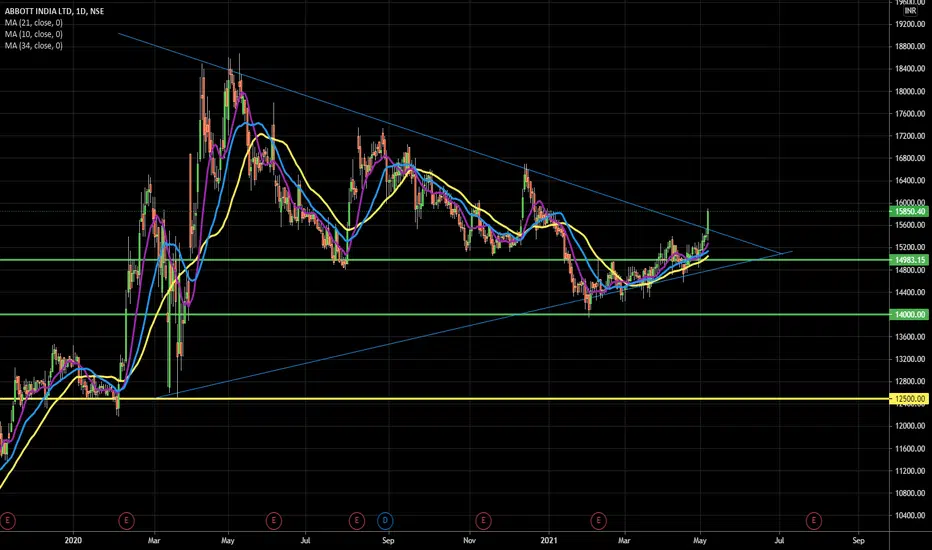
Long Abbott India for target of 26000Abbott trading in a closed triangle pattern on Monthly and weekly charts. It can breakout on either side.
At the lower level of the triangle there is a volume coming in indicating strength currently. Formed hammer on last monthly chart candle.
If it follows then target of 26000 can be seen. Stop loss will be base price of triangle pattern. Note: On closing basis else you may sell at fake breakdown.
This is long term chart not short term so need patience for investing and wait.

ABOTTINDIA 200 Days EMA ABOTTINDIA is taking good support on 200 EMA in a daily timeframe, also the monthly timeframe RSI looks very strong.
Entry: 23180
Target: 25007
Stop Loss: 22090
This is my first Idea shared on the Trading View platform.
Wish me Luck

Abbott India at breakout levelsNSE:ABBOTINDIA has been at this zone before, but this time there is a rally in the pharma sector itself. Keep an eye on this share at the current levels of 24,000. Any breakout above here can be a great opportunity to buy.

Abbott India is gearing up to give Breakout.Company's Overview.
Abbott India Ltd is one of the market leader and multinational pharmaceutical company in India with a global presence in over 160 countries. It has a legacy of more than 130 years in the industry.
Revenue Breakup.
In FY22, injectables contributed around 40% of the revenues, followed by tablets at 39%, liquids at approximately 16%, capsules at 3%, and other products at 2%.
Financials.
>>Almost debt free company.
>>ROCE- 41.1%, Which is considered to be an excellent return.
>>Good growth can be seen in net profit margin.
>>Maintaining a healthy dividend payout of 76.8%.
Technical.
As we have seen Last week, all chemical stocks had a good rally. It looks like this rally will continue further. So we will keep a close track on this stock because it still falls under one of the undervalued stock category.
This stock was consolidating within an uptrend parallel channel. Last week, it closed near its resistance level.
If it breaks out with a big candle and significant volume, we can enter the trade. We'll use a 1:1 risk-reward management strategy for this trade as explained in chart.
This is my Analysis, I might be wrong sometimes Please do your 'own' due diligence before taking trades.

abbott india Long for target of 23800Abbott India which was trading in the triangle formation has broken out with upper side momentum.
One can go long on this stock with target of 23800 in coming months

NSE: Abbott India Elliott wave ProjectionOverview:
Abbott India has accomplished the impulsive wave 3, and the price is forming corrective wave 4. Price has occurred the sub-wave A. and Sub-wave B. Sub-wave C of 4th wave is in progress.
After completion of wave 4, the price will start its bull run.
Fibonacci relationship and wave Formations:
Wave ((1)) is a five-wave impulse.
Wave ((2)) retraced 50% of wave ((1)).
Wave ((2)) has taken 23 months to finalize.
Wave ((3)) is a five-wave impulse.
Wave ((4)) looks like a sharp correction.
Rule of alternation indicates variation between two corrective waves in terms of time, distance, and formation.
Because wave ((2)) was a complex correction, wave ((4)) should be a sharp correction.
Destiny of wave ((4)):
Wave ((4)) can terminate near the previous corrective wave (iv) at 13994 .
Wave ((4)) can end at 15064 , which is a crucial support level.
The common retracement of wave ((4)) is 38.2% , but the price has broken down this level. Next Fibonacci retracement level is 50% at 13967.
Please note that the corrective channel has broken down, so bulls can enter when the price renter into the parallel lines. Otherwise, the price has bearish sentiments.

Abbott Attempting a BreakoutAbbott India looks very strong on charts and is attempting a breakout at ATH Levels. If it sustains, sky is the limit. I also feel that the pharma rally has begun with a lot of pharma stocks showing momentum and strength in this market. Keep on radar. Buy above 22850 only and keep that level as stop loss.

Abbott India LtdLevels given of 1 Year high and low, if levels are broken on either side then i can give a good trending move, keep it under you radar for investing

ABOTT INDIA: OUTPERFORMERstrong chart
relative outperformer in pharma space
stock above key averages
pharma index seen a decline of 7 % odd in past 11 session while this counter is trading with strength
formed a dual bottom
trading above neckline.

ABBOTT INDIA FUTURE TRADE
Price has reacted to a Demand is heading towards the Target
Risk : Reward = 1: 2.43

ABB INDIA LTD NSE:ABB
ABB INDIA LTD: this stock is looking good for short term. volume increasing
can buy above 2575 for the targets 2586-2588, 2598-2600 and 2607,2616

Abbott Analysis - Monthly ViewAbbott looks bearish on Monthly TF due to drop in delivery% and Bearish Divergence on RSI.
The Target & SL has been updated on the chart.
This is solely my view and for educational purpose only.
let me know your thoughts in the comments section

Abbott India Chart Analysis !!📈 ABBOTT 📉
My Findings :-
1. Higher High and Higher Low Formation.
2. Breakout from a Swing High and Support Turned Resistance.
3. Close Above March 2022 High.
Bias- Long
Target- 19513, 20613, 22028 and 23201
SL- 16024
RR- 1: 2.5
All Important Supports and Resistances are drawn in chart. All levels are on closing basis.
Please have a look and revert back if you need some more study on it.
Disclaimer : Consult Your Financial Advisor Before Taking Any Decision On This Analysis.

Abbott India Ltd - 04.03.2022Abbott India Ltd - 04.03.2022
The stock is trading @ 17459 levels
Let the prices go above 17940
There is a SUPPORT @ 16800 levels
There is a SPINNING TOP in Daily Chart
The prices are above EMA
Watch out for the price action

Abbott India bottom formation in placeWhile looking at the chart of Abbott India, it does feel like the bottom has been made. keep a stop loss at 16,000 and go long with a target of 19,500. It is a fundamentally strong stock and hence, I do expect a bounce in this one.

H&S pattern Short near term, Long term still a buyAbbott India Near term short ... Buying range and Stop loss provided on the chart.

Long Candidate for Swing Trading We can expect at bounce back on the charts.
Price has corrected and touched 200 EMA
RSI taking support at 30 levels
Weak below : 17300 (SL)
Disclaimer: View for Education purpose only, not to be taken as a trading advice.

Chart of the Week (31/07/2021)Abbott India looks very bullish and has made a new lifetime high. I expect 2x-3x in the next 4-5 years. Short term targets will be 20%-30% in the coming 3-4 months. Keep Stop Loss at Rs.18500

Major BreakoutAbbott India has given a major breakout on the daily charts. It looks bullish on positional basis.