BCOUSD : Bullish Momentum Signals Potential Surge to $104-$124 Brent Crude Oil charting its potential trajectory amidst current market dynamics. Through a meticulous examination of technical indicators and chart patterns, a compelling case emerges for an imminent bullish surge within the $104-$124 range.
Based on the comprehensive analysis of these factors, it is anticipated that Brent Crude Oil to embark on a significant upward trajectory, targeting a price range between $104 and $124. This projection aligns with the prevailing bullish momentum and anticipated price appreciation.
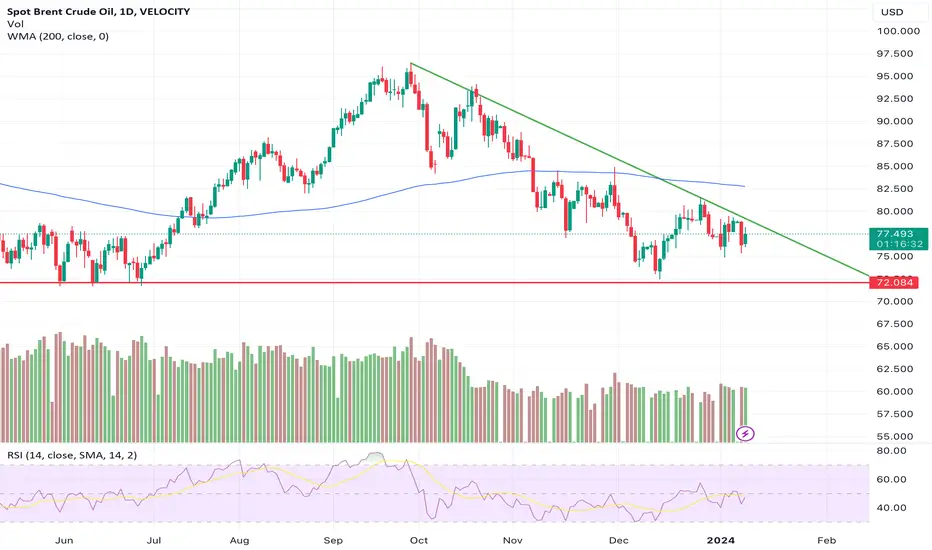
Brent

Crude levels - Bearish bias due to fundamentalsOn a downtrend with strong support at 72. On confirmation of breaking upper line can enter but problem is with fundamentals. Saudi cutting 2 dollars is bearish as it decreases the incentive for US producers and showes the lack of confidence with respect to demand. So Can even push below the 72 support and go down before uptrend. Till then wait and watch
Brent Oil buyers need validation from $92.50Brent oil buyers take a breather after posting the biggest daily jump in six months as the overbought RSI (14) line prods the energy bulls below a three-week-old horizontal resistance surrounding $92.50. However, a clear upside break of the 200-SMA and bullish MACD signals suggest further upside of the black gold price. Hence, the quote is likely to cross the immediate hurdle surrounding $92.50, which in turn will allow bulls to challenge the monthly high of around $94.30. In that case, September’s peak of near $96.50 and the $100.00 psychological magnet will be in the spotlight.
On the contrary, Brent Oil’s pullback remains elusive beyond the 200-SMA support of $90.80, quickly followed by the $90.00 threshold. Following that, a broad horizontal area comprising multiple levels marked since early September, close to $89.00-50, will challenge the energy sellers. Should the Oil bears manage to conquer the $89.00 support, its fall to the previous weekly low of $85.76 becomes imminent. However, the monthly low of $84.17 and the previous monthly trough surrounding $82.00 will test the south-run afterward.
Overall, Brent Oil price stays on the way to refreshing the monthly high unless it breaks the $89.00 support.

Nifty...Brent Crude... The Fundamentals and the Technical aspect
In our previous updates I had mentioned that Brent crude above $90 can be a cause of worry.
The current chart set up for Brent crude suggests it can go above $100
The Fundamentals
If crude is heading higher, it could add pressure on Indian Imports.
At the same time, the recent Quarterly results of our major IT export companies are not encouraging enough to suggest that it would be able to offset the Balance of Trade.
As a result it could increase India's trade deficit and if the rise in oil prices is passed on to the consumer then it would impact inflation as well.
The Technical aspect
Nifty so far is trading above 21 day EMA ( currently around 19684 ) and 63 day EMA ( currently around 19515 ).
If Nifty stays below 63 day EMA for 3 consecutive days, we could see Nifty trending lower possibly towards 18820 odd levels .
There you go... Current scenario and Important levels have been discussed...
Hope it is helpful...
Take care & safe trading..
Do Like if you find it useful
Follow for more trading ideas...!!!
Disclaimer
-The view expressed here is my personal view
- Past performance is not a guarantee for future predictions
- I have been wrong in the past and can be wrong again in future too
- Use this for educational purpose
- Any decision you take, you need to take responsibility for the same
- It's your hard earned money. Treat it wisely
- Trade / Invest keeping in mind your trading style, goals and objectives, time horizon & risk tolerance
- if trading in F&O, understand that F&O trading involves risk
- Do take proper risk management measures
- Do your own analysis and consult your financial adviser if need be

Brent Crude: Set for 104-108The chart set up suggests support around 85-87 odd levels
Minor resistance around 98 and eventual target for the set up could be 104-108
Risk::Reward ratio favors to go Long
Take care & sage trading..!!!
Disclaimer
-The view expressed here is my personal view
- Past performance is not a guarantee for future predictions
- I have been wrong in the past and can be wrong again in future too
- Use this for educational purpose
- Any decision you take, you need to take responsibility for the same
- It's your hard earned money. Treat it wisely
- Trade / Invest keeping in mind your trading style, goals and objectives, time horizon & risk tolerance
- if trading in F&O, understand that F&O trading involves risk
- Do take proper risk management measures
- Do your own analysis and consult your financial adviser if need be

CRUDE OIL(US OIL)US oil has broken its major downtrend line and is managing to test and sustain above the supports , is buy on every dips untill it stays above 70$ levels , keep SL very small at 60$ , any monthly candle closing below 70$ is an exit from trade , RR looking great and potential reward on the upside is very high


Brent oil buyers need successful break of $100 to keep controlBrent oil crossed a downward-sloping resistance from mid-June to refresh the monthly top on Friday. However, a sustained break of the 100-day EMA, around $99.50 by the press time, as well as the $100.00 threshold, appears necessary for the buyer’s conviction. Following that, the black gold price could quickly rise towards the 50% Fibonacci retracement of the June-September downturn, near $105.00. In a case where the commodity remains firmer past $105.00, it can easily challenge the July 29 swing high surrounding $111.30.
Alternatively, pullback moves could aim for the previous resistance line, around $95.20 at the latest, a downside break of which could tease the sellers. In that situation, the bear could aim for the weekly support line near $91.50 before rushing toward the $90.00 round figure. It’s worth noting that the oil’s sustained trading below $90.00 won’t hesitate to revisit the multi-month low marked in September, around $83.25.
Overall, Brent oil prices recently overcame one key hurdle to the north but the buyers need validation.

Brent Crude can test USD 118Brent Crude can test USD 118 per barrel in the medium term to long term perspective and at the maximum resistance is seen at USD 183 per barrel.

Brent oil again approaches $116.00 key resistanceBrent oil prices managed to bounce off the crucial SMAs and 61.8% Fibonacci retracement of the late February to early March rally, despite posting meager weekly gains. Firmer RSI and the higher-low formation since April also keep the black gold on the bull’s radar. However, the upside bias needs validation from a two-month-old horizontal hurdle surrounding $116.00. Should the UK energy benchmark rally past $116.00, it becomes capable of crossing the $120.00 threshold, which in turn makes it eligible to challenge the late March high near $124.50. In a case where the commodity prices manage to stay firmer past $124.50, the yearly peak of $135.35 will gain the market’s attention.
On the contrary, pullback moves remain elusive unless staying beyond an area comprising the 50-DMA and the 20-DMA, around $109.00. If at all the quote drop below $109.00, the $100.00 psychological magnet, also including the 78.6% Fibonacci retracement, should be on the bear’s hit list. It’s worth noting that April’s low of around $99.30 is the last defense for the Brent oil buyers, a break of which will make it vulnerable to revisiting February lows surrounding $90.00.
Overall, Brent oil prices are ready to rise but the bulls need to cross the $116.00 barrier.

Brent oil buyers seem running out of steamAlthough a fortnight old rising channel portrays the bull’s command over Brent oil, backed by the fears of a supply crunch, the commodity prices have failed to portray a notable run-up. On top of that, the quote is heading towards a short-term key hurdle surrounding $115.70, comprising a horizontal line from late March and the upper-end of the mentioned channel. That being said, the RSI line also approaches overbought territory, which in turn poses the risk of a pullback move. Even if the energy benchmark rally beyond $115.70, multiple hurdles around $119.00, comprising the 78.6% Fibonacci retracement of March 26 to early April fall, as well as the $120.00 threshold could test the buyers.
Meanwhile, the 200-SMA and the support line of the aforementioned channel, respectively near $109.70 and $107.30, put a floor under the short-term downside of Brent oil. It’s worth noting, however, that a clear break of the $107.30 will defy the bullish chart pattern, namely the rising channel, which may direct the bears toward $104.00 and $100.30 before highlighting the $100.00 psychological magnet.

UK Brent Oil. Looks Bearish In Short Term.TVC:UKOIL
UK Brent Oil can retest or break 102$ per barrel in short term.
Ukraine And Russian Crisis cool off can make oil cheaper.
Trade on your own risk and analysis.

Nine-month-old support line becomes crucial for Brent oil bearsBrent oil sellers cheer a clear downside break of 200-DMA and 50% Fibonacci retracement of March-October upside around 13-day low. While bearish MACD signals and descending RSI line, not oversold, favor the commodity sellers, an upward sloping trend line from March 23, around $68.70, is the key for the quote’s further downside. Should the commodity bears drop below $68.70, the 78.6% Fibo. and August month’s low, respectively near $66.20 and $65.10, will return to the charts before directing the British energy benchmark towards March’s low of $60.44.
Meanwhile, an upside clearance of the support-turned-resistance confluence around $73.50 will aim for a 38.2% Fibonacci retracement level of $76.70 and then to July’s swing high near $78.50. In a case where Brent oil buyers manage to cross the $78.50 mark, the $80.00 psychological magnet and $82.80 will act as buffers during the run-up targeting the yearly peak of $86.60. To sum up, Brent oil bears tighten the grip but the ball may slip if the trend line support holds.

Brent oil bears set to retake controls, 61.8% Fibo. eyedBrent oil fades bounce off 61.8% Fibonacci retracement (Fibo.) level of September-October upside, drops back below 200-SMA amid bearish MACD signals during early Friday. The UK benchmark for oil currently eyes 50% Fibo. level of $81.55 on the way to retest the early November trough surrounding $80.80. However, any further downside will be challenged by oversold RSI conditions and the $80.00 round figure.
On the contrary, 200-SMA guards immediate upside around $83.50, a break of which will direct the oil prices towards the monthly peak of $86.00. In a case where the Brent bulls refrain to pause around $86.00, October’s high near $87.00 and June 2012 low near $88.50 should gain the market’s attention. To sum up, Brent oil prices are set for a corrective pullback but the overall bulls trend remains intact.

Brent oil bears need $78.00 breakdown to retake controlsBrent oil prices consolidate the heaviest daily loss since late August, not to forget reversal from November 2014 levels, while picking up bids to $81.70 during early Thursday. The oil benchmark refreshed the multi-day top the previous day but overbought RSI joined firmer USD to drag the quote towards the first negative daily closing in six days. However, the quote stays inside a rising channel formation, not to forget remaining beyond a convergence of 100-SMA and a seven-week-old support line, to keep buyers hopeful of witnessing the fresh high above $84.00. In doing so, an upper line of the short-term rising channel, near $84.50, may play a role to trigger another pullback amid likely overbought RSI conditions, which if ignored could propel the upside moves toward the $90.00 threshold.
During the pullback moves, the stated channel’s support near $80.60, followed by the $80.00 psychological magnet, will be important for short-term traders to watch. Should oil prices drop below $80.00, the aforementioned support confluence around $77.80 will be in focus. Overall, oil bulls are tired but not out of the woods, which in turn seeks a strong catalyst for a pullback, highlighting today’s US debt ceiling vote and Friday’s NFP figures for conviction.

Brent oil buyers can ignore pullback towards monthly supportBrent oil consolidation the early week’s oversold RSI conditions while dropping back below $78.00 on Wednesday. However, an ascending support line from August 23 and 100-SMA, respectively around $76.70 and $75.00, will challenge the quote’s further weakness. Even if the British oil benchmark drops below $75.00, a horizontal line comprising multiple levels marked since August 30, near $73.50 will challenge the bears.
On the contrary, the corrective pullback will gain momentum beyond $79.00, targeting the $80.00. During the black gold’s further upside past $80.00, the May 2018 peak near $81.00 can offer an intermediate halt during the run-up to the three-year high of $86.95. It’s worth noting that a clear upside break of the $87.00 will be an end to the bear’s reign.

Brent oil buyers can ignore pullback from 18-day topWith hurricane Ida easing to category 3 storm and the market sentiment dwindles over geopolitical, as well as covid, woes, Brent oil prices step back from multi-day high towards $72.00 during early Monday. The commodity’s Asian session run-up couldn’t cross the 61.8% Fibonacci retracement of July–August downside. However, a convergence of 200-SMA and 50% Fibonacci retracement level near $71.80 restricts the quote’s short-term downside. Hence, oil buyers may remain hopeful unless breaking $71.80, after which the losses could mount as the sellers march towards 23.6% Fibonacci retracement level, also comprising lows marked since July 20, around $68.20.
It’s worth noting that the fresh buying will aim for a clear upside break of 61.8% Fibonacci retracement level of $73.35. Following that, a downward sloping trend line from early July, near $74.40, will be important to watch for Brent oil buyers. In a case where the commodity bulls manage to cross the $74.40 hurdle, late July top near $76.60 may offer an intermediate halt during the rally towards the last month’s high near $78.45.


Brent oil drops from 21-DEMA as EverGiven refloats in Suez CanalEver Given’s refloat in Suez Canal opened the one-week-old blockage in the busy global route during early Monday. The move not only helped market sentiment but also weighed on the oil prices and dragged Brent Oil from 21-day EMA. Given the fundamental reason and the commodity’s repeated failures to cross the key EMA, the quote is likely to revisit the 61.8% Fibonacci retracement level around $61.15. However, any further downside will be tamed by the monthly low of $60.44 and the $60.00 psychological magnet.
Meanwhile, an upside clearance of a 21-day EMA level of $64.85 can trigger the oil benchmark’s recovery moves towards the one-month-old horizontal resistance around $67.45-50. It should, however, be noted that a sustained rise past-$67.50 will propel Brent oil towards the mid-March top near $70.50 before directing oil bulls to the monthly peak of $72.00.

Brent oil seeks fresh buying but $65.00 probes buyersBrent oil’s bounce-off early February low has a bumpy road ahead as 200-SMA joins the previous support line from February 19 to challenge the commodity buyers around $65.00. Even if the black-gold prices conquer the $65.00 hurdle, March 10 low and February 25 top, respectively around $67.00 and $67.70 could test the oil bulls. It should also be noted that bearish MACD suggests further hardships for the commodity’s corrective pullback.
Meanwhile, six-week-old horizontal support around $61.85 restricts the quote’s immediate downside ahead of 61.8% Fibonacci retracement level near $61.00 and the $60.00 psychological magnet. If at all the oil bears dominate past-$60.00, the late January tops surrounding $56.00 may return to the chart. Overall, oil bears are likely rolling up their sleeves to consolidate the latest run-up.

Brent oil bulls confront key hurdle around $72.00Having failed to conquer $72.00 during early 2020, Brent bulls again confront the key hurdle comprising 78.6% Fibonacci retracement level of October 2018 to April 2020 south-run. Although fundamentals are favoring the black-gold buyers, overbought RSI and the strong upside resistance challenge the commodity’s further upside around $72.20. If at all, the bulls conquer the same, April 2019 peak surrounding $75.50-60 can validate the run-up to the late-2018 top near $87.00.
Meanwhile, the $70.00 psychological magnet can offer immediate support to the energy benchmark before recalling the mid-February lows close to $62.00. It should, however, be noted that the oil bulls should remain hopeful unless the quote drops below 61.8% Fibonacci retracement and 200-week SMA area near $60-59.00. Following that, the bottoms marked during January 18 and 22, 2021, close to $54.50, will be in the spotlight.

Brent oil bulls dominate inside gramophone at 13-month topTrading sentiment on the floor remains quite depressing as markets await Fed Chair Powell’s half-yearly testimony. However, the bullish chart formation on the four-hour play keeps Brent oil buyers hopeful, despite the latest pullback from $66.76. It should, however, be noted that the oil bulls need to stay away from $63.40 and $62.90 supports comprising 50-SMA as well the gramophone support. If at all the quote slips below $62.90, the $60.00 threshold and 200-SMA level of 58.60 will gain the market’s attention.
Meanwhile, the $67.00 round-figure should lure the short-term buyers before testing them by the gramophone’s upper end near $67.40. It’s worth mentioning that July 2019 peak surrounding $68.20 and the $70.00 will offer extra filters to the north of $67.40. If at all the oil buyers remain dominant past-$70.00, the previous year’s peak close to $72.30 should return to the chart.

💡Brent Crude Oil - Weekly technical analysis updateMidterm forecast:
54.40 is a major support, while this level is not broken, the Midterm wave will be uptrend.
Technical analysis:
While the RSI uptrend #1 is not broken, bullish wave in price would continue.
A peak is formed in daily chart at 64.83 on 02/18/2021, so more losses to support(s) 58.65 and minimum to Major Support (54.40) is expected.
Price is above WEMA21, if price drops more, this line can act as dynamic support against more losses.
Relative strength index (RSI) is 66.
❤️ If you find this helpful and want more FREE forecasts in TradingView
. . . . . Please show your support back,
. . . . . . . . Hit the 👍 LIKE button,
. . . . . . . . . . Drop some feedback below in the comment!
❤️ Your Support is very much 🙏 appreciated! ❤️
💎 Want us to help you become a better Forex trader ?
Now, It's your turn !
Be sure to leave a comment let us know how you see this opportunity and forecast.
Trade well, ❤️
ForecastCity English Support Team ❤️
