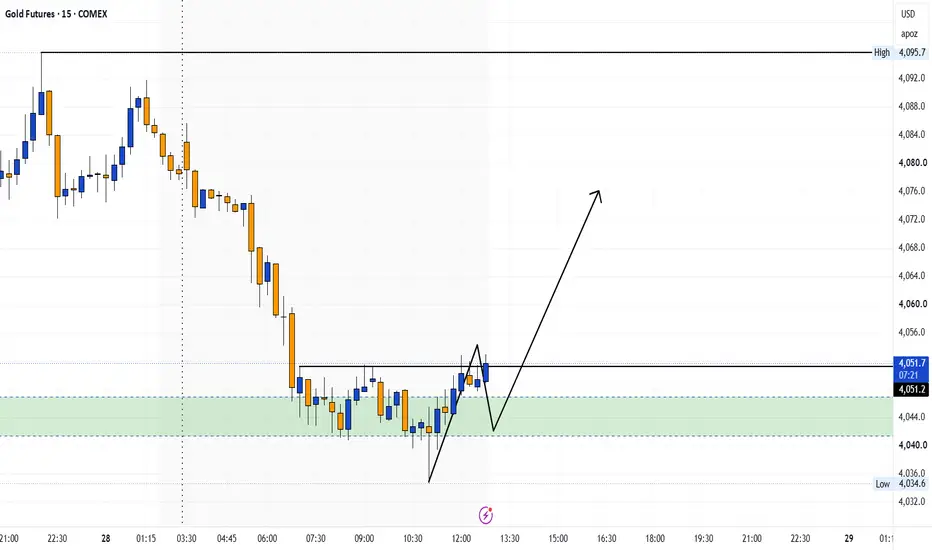
GC1! Analysis | LOOKING FOR LONGGC1! Analysis:-
The higher timeframe structure still suggests that the primary bullish trend remains intact. The recent downside move appears to be a retracement within that larger trend.
On the lower timeframe, I'm watching for an Inverse Head & Shoulders pattern to develop. If the pattern completes with a valid breakout and confirmation, I'll look to plan a long trade in the direction of the higher timeframe trend.
If the Inverse Head & Shoulders doesn't form, I'll wait for another clear b
GC1! (Gold Futures)
Gold Update: Watching for a Potential Long OpportunityThe target on my previous Gold short trade has been achieved.
Now, I'm looking for a possible long setup, as I believe the 1-hour (higher timeframe) trend has shifted to bullish.
The earlier short trade was simply a retracement move within this larger bullish structure.
My current approach:
I have marked a key level (line) and an arrow on the chart.
My first condition is to see a strong candle close above that marked level.
At the same time, the recent swing low should remain intact.
If t
21/06/2026 Gold AnalysisFOREXCOM:XAUUSD
Gold could potentially sweep its sell-side liquidity while reacting from its 4H FVG. Given the current geopolitical tensions, that liquidity sweep could happen sooner than expected.
For me to take a short trade on Gold, I need a valid short setup to form on the lower timeframe. If that setup develops, I’ll look for short entries in Gold.
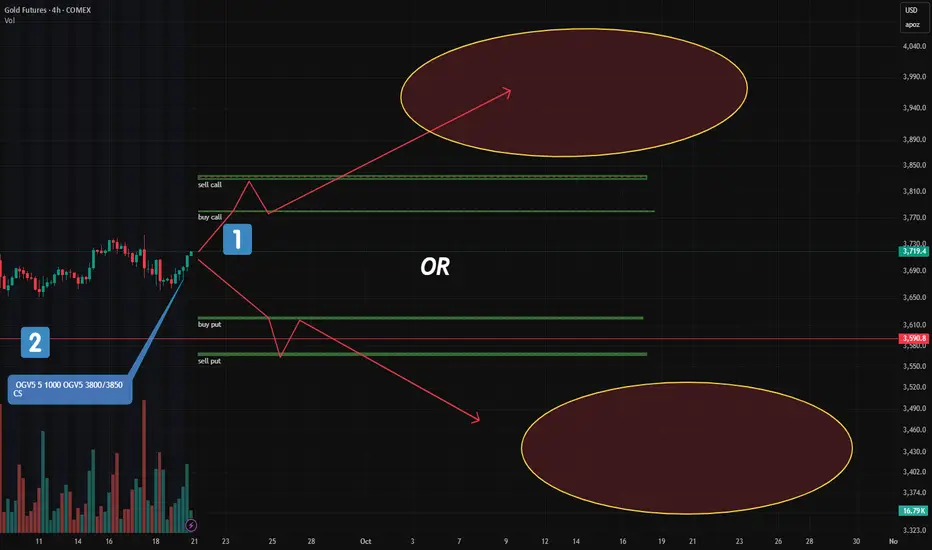
Gold: Major New Option Portfolios Signal Strong Moves AheadFriday’s CME report showed a surge in large option blocks in gold — two of them stand out.
🔹 1. "Long Condor" on December Futures (GCZ24)
This is the most significant structure added:
Targets a move below $3,620 or above $3,780
In other words: a breakout is expected, not consolidation
📌 Key point:
A "Long Condor" profits from volatility, not direction.
It wins if price moves sharply — up OR down — but loses if it stays flat.
🔹 2. Bull Call Spread (Oct Series): $3800–$3850
Another key play:
Gold Cooling Off After ATH Consolidation or Correction?Gold cooled off a bit after hitting a fresh ATH around 3675, right near the monthly R3 level. This pullback, however, looks more like a healthy breather than any real weakness, since the key 3600 support is still holding strong. Right now, price is taking support around 3620–25, and bulls are doing a good job defending this zone. As long as this area stays intact(H4 close), the higher-high structure remains valid, meaning gold can easily revisit 3650 or even push back toward the highs.
For now,
Gold Still Looking weak Gold prices have shown weakness, with the market currently positioned below key resistance levels, suggesting a bearish outlook in Intra day. The immediate resistance is seen at the previous support level around 2620-2625, which may act as a psychological barrier for the price to overcome.
Immediate Resistance: 2620-2625 - This level has previously acted as support but now could serve as resistance. A move above this could signal a potential short-term recovery.
Immediate Support: 2588 - Th
Gold in FOMC weekGold now under sideways area as marked on chart and for this week price opened under weekly pivot (2667) ; we have seen two days of good decline in last week closing.
Personally I want to see more corrections towards 2610 and then 2530 area for potentials bottom for December , breakdown from 2530 on daily / weekly can open room for decline.
In case of bullish scenario after FOMC price need to re claim 2790 and then we can expect bullish continuation towards 3000.
As during year end markets can
Gold taking a breakAfter PPI data gold is taking break and we have seen a good correction from the buy move : In previous posts I was expecting more strength before a pullback, but gold price faced big resistance at 2715-21 zone.
Now if we draw the fib levels for this current correction that started form yesterday the zone 2700-06 is resistance area for bulls and bull need to claim this zone first to see higher levels and under this we can expect more decline.
In lower side the previous day close (2680) is the lev
Gold View On CPI weekGold price opened with a positive gap today due to geopolitical scenario but still trading under range (2620-50) , to get clear direction price need to breakout this range , we have some major data this week that going to add volatility on Intra day and can decide the next move for short term, as updated last week I am holding sell trade (Already closed multiple entries in profit last week) but still expecting more decline (technically) ; my average sell price is at 2652 and considering my SL at
Gold: Sell on the rise is working and still good Gold: Sell on the rise is working and still good , yesterday price failed to re claim 2650 on higher time frame and rejected from there on daily time frame and now price re visiting the support level:2625-28, breakdown from here can result in good decline in lower side so sell on the rise is still good for Intra day.
Gold Started the week with Big Bearish Engulfing As predicted in last week posts and on weekly analysis also , gold is moving down and started the week with a big bearish engulfing on daily time frame .On Intraday the resistance area is at 2630-50 (Fib Golden Zone) and under this area we can expect more decline in lower side , In lower side the first support area is at 2562-70 (HVN)(First TP for Sell) and next support area is at Bullish Imbalance zone @ 2530-40 (Second TP for Sell), so selling seems to more favourable for Intra day as of now.
Gold : Time for reversal Gold price is under pullback as expected and seems like we are about to enter in continuation in lower side as per wave ABC ....Price currently trading near to High volume area and we can expect a reversal soon (Today or tomorrow ,means I am expecting top of this bullish correction cycle within this week). In higher side we have to watch :
2650-53(Weekly R1 + Near to psychological resistance 2650)
2663-93( Fib Golden zone + High Vol Area).
Gold is under pullback : Read my last postAs expected gold is finally under a pullback wave and price opened with a gap , this gap is now going to act as good high volume support area(2560-70).
At the time of writing this post price is facing resistance on weekly pivot(2595) and bulls need to re-claim this level on H4 to see higher levels , First resistance (Target in case of buy) that we have to watch is area at 2630-40(bearish Imbalance) and the final resistance zone as per fib is 2663-93 from where we can re load the sell for target
Gold : due for a pullback : Unconfirmed Gold price seems to be bouncing on Bullish Imbalance on daily TF (Seems like a hammer on daily) but we need a green follow up day to confirm this as possible pullback (The length of pullback is not clear right now but we can expect it approx. 70-80$ from the recent low).
In higher side we have to watch 2595 (First Fib retracement level on daily) and then 2600-20 area for re sell opportunities on confirmation.
Gold under Non stop selling pressure Gold is under Non stop selling pressure and now reaching the support area as per daily TF , on H1 gold is forming a falling wedge pattern , and for any pullback price need to breakout the trendline from higher side , On Higher TF there is no good indication of any pullback as of now but I think every DIP is a buying opportunities as at present I am not expecting a bearish reversal for a longer period.
First support area is at 2530-55 area.
Second Support area is at 2500-25 area.
Gold : Still week but looking for a pullbackGold price tested 2600 in yesterday trading session and still looking weak. For Intra day price is forming tringle formation on H1 and breakout from this formation in either side can give us good move on that side , personally I think a pullback is due at this point and we can expect a test around 2635-40 area for Intra day.
If gold going to follow this view then at 35-40 we will wait for confirmation of sell or higher levels .
Gold :Due for a pullback: Wait and watch zoneGold sold of hard in yesterday trading session as expected and explained in previous post and now trading below weekly S1 (2635) and currently trading at support area (2605-20) , as we have seen a good decline already so at this support area we can expect a pullback (but still there is no major confirmation of buy on any TF yet) , so idea is to wait for pullback near to major resistance area( 2645-55 : On volume profile ) and confirmed rejection we can look for sell opportunities .
Those who wan
Gold : More decline ahead Gold plunged to a three-week low below 2650 today after the 2024 US Presidential election. The Republican candidate, former President Donald Trump, won the contest, boosting the dollar demand and US Treasury bond yields.
Gold price closed the last day with a very bearish candle on day time frame and seems like that price can make more decline in coming days...For today the idea is to wait for pullback on or before FOMC rate decision and then selling is seems to favourable.
In higher side the fi
Gold trying to re claim 2700...What next?we have seen good comeback of gold price in yesterday trading session and gold price tested 2700 level again, on price action gold price re-tested the trendline from where the price breakdown on Wednesday and seems like facing resistance now.
In yesterday trading session we have not seen and major rejection in higher side and till now there is no major rejection as of now , so idea is today is to wait for a good confirmation on H4 , or wait till London session , if price stays below 2700 then w
Gold is under pressure on Intra dayGold price is still in range ,The US Dollar Index gains ground as early exit polls increase volatility and seems like that the rise in DXY adding pressure on gold , Gold price is hovering over to Gann -90° Level (2737) from the beginning of the week.
In higher side the weekly Pivot (2750) is acting as resistance and under this level price can make a move in down side.
In down side we have to watch price action at Gann -120° Level (2720) , weekly Pivot 2710 and 2700 for possible buy opportunitie
Gold on US Election dayGold price is now breaching last week low and seems like can resume the ongoing correction. In lower side we have to watch weekly S1 (2710 also psychological level 2700) and weekly S2 (2685) for buying opportunities as overall price is still maintain the bullish bias.
On Intra day selling is good now under PDH.
Gold back in range Gold price is now again entered in range area and we have to wait for breakout this range area for next move,
The uncertainty around the US presidential election and Middle East tensions might boost the safe-haven demand, supporting the gold price.
On volume profile we can see that the current price is trading under High Volume area, in Lower side if price breakdown Friday low then we can expect test at weekly S1 or at psychological support at 2700, In higher side the resistance is at weekly piv
Gold near 2800Gold climbs to new ATH at 2,781 as mixed US data bolsters expectations of a Fed rate cut in November.
Last day candle is a good bullish candle and gold price moving higher today in continuation , price is now trading above weekly R1(2767) and testing rising wedge pattern resistance trendline on daily time frame , from here price can test psychological level 2800 or Monthly R2 (2811) and then we can expect some correction or profit booking as per daily TF ,right now there are two possibilities if
Gold is in correction Gold price facing resistance at Fibonacci golden zone (2733-39: marked with red zone) and now moving towards the support area (green zone : at Wednesday low), under PDH and under resistance trendline sell is good towards the support area where price seems to be completing H&S formation and the neckline is at 2708-10 area, if price breakdown from H&S formation a good correction is expected.
On buying side we have to wait for breakout at PDH and breakout on the resistance trendline (Why Buying? b