XAUUSD GOLD NEXT MOVE ON (15 OCT 2026)#XAUUSD UPDATEDE
CURRENT PRICE - 4147
BEST SELLING AREA 4150-4160
If price stay below 4180, then next target 4125,4100 and 4070 and above that 4220
Plan;If price break 4160-4180 area,and stay below 4150,we will place sell order in gold with target of 4125,4100 and 4070 & stop loss should be placed at 4180
Exideinds
Sensex - Expiry day analysis Oct 15The price is moving inside an ascending channel and now it is testing the lower trend line of the channel. In the daily chart, you can see the strong resistance at 73000 zone. The price have to sustain above that to move up further.
Buy above 72680 with the stop loss of 72540 for the targets 72820, 72960, 73120, 73280 and 73420.
Sell below 72400 with the stop loss of 72580 for the targets 72180, 72040, 71880, 71720 and 71580.
71700 is strong support, and 73000 is strong resistance. The price ca
Nifty Weekly 200 EMA Support test BIG move PossibleHello Everyone,
On weekly Niftys historical chart whenver breaks 200EMA downside there is approx 15-20% More correction was there historically this was happned 3 times from year 2000. another is whenever it breaks down RSI hits low nearly about 20-22 only weekly chart so now RSI is more than 34 which gives more potentils another is its overall negative momentum. with trendline and EMA support its make or break situations
now Condiering global tentions and rising bank rates and other poltical
BRIAN XAUUSD – SELL POC REJECTION INSIDE DESCENDING CHANNEL
Gold is still trading inside a corrective bearish channel, and the current structure is very clear: price is rotating between the Sell POC above and the buy value zones below.
On the 45-minute chart, gold is moving under a descending trendline structure after failing to hold the upper value area. Price is currently around 4,159, sitting in the middle of the channel. This is not a clean bullish breakout yet. The market is still respecting lower highs, and every recovery attempt is being capped
XAUUSD — Bearish Wave 5 Toward 4,090
Gold is showing a short-term bearish structure after failing to hold the upper recovery area. From Kelly’s view, the chart suggests that XAUUSD may still be forming a downside Elliott Wave sequence, with price now trading below the Sell zone liquidity area.
The key idea is simple: gold may create a small rebound first, but as long as price stays below the sell zone, the main structure still favors another bearish leg toward the lower wave 5 buy zone.
⟡ Market structure
Gold is currently tradi
4H BTC, Depend which line break!📊 BTC 4H – Demand Zone Analysis
Bitcoin is approaching a key 4H demand zone. Watching for a strong bullish reaction and confirmation before expecting a potential move higher. A breakdown below the demand zone could invalidate the bullish setup.
⚠️ Waiting for confirmation. Technical analysis only, not financial advice.
H1 Buy Zone Rebound Setup
Gold is trading around 4,156, holding near an important H1 support area after the latest rejection from the 4,190 region. Macro conditions remain mixed as traders wait for U.S. CPI today, followed by PPI and other key data on Thursday. Gold was slightly softer in the previous session as elevated rates and a still-firm dollar limited demand. Reuters
The dollar has pulled back from its recent 18-month high, but Fed policy remains a headwind. Several policymakers still see another rate increase as
We might see NIFTY to recover more above 22760! As we can see NIFTY showed sluggishness after being bullish last day. It still can be seen in a consolidation, break of which could show strong upmove! The level we should keep track of is 22760, on break of which, show show good short covering. So plan your trades accordingly and keep watching everyone.
Banknifty Intraday Analysis for 15th October 2026NSE:BANKNIFTY
Index is near 55700 - 55800 resistance range and further upside momentum expected when Index breaks and sustains above this resistance range. On the downside, Index has support near 55000 level.
The upward moment may lead the Index to 56000 – 56100 resistance range in upward momentum and if the index crosses and sustains above this level then may reach near 56700 – 56800 range.
On the contrary, the downward moment may drag the Index to 54600 – 54500 support range in downward
UPLIn a smaller timeframe, after a steady uptrend, the price consolidated, and now it is giving a breakout. In the daily timeframe, the price shows bullish strength.
But above 522, with the stop loss at 517, for the targets 526, 531, 536 and 542.
Resistance levels are 534 - 536 and 544. Profit booking or a pullback can happen at these resistance levels.
Always do your analysis before taking any trade.
DIVGIITTS Classic Break and Retest Setup at Key SupportOverview & Technical Analysis
Looking at the weekly chart for Divgi TorqTransfer Systems Ltd, we can observe a textbook example of a "break and retest" technical setup.
The stock recently broke out of a structural base, forcefully clearing a major horizontal resistance line at 1,115.4.
This breakout was accompanied by a massive surge in buying volume, validating the upward momentum.
Following the initial upside rally, the price pulled back to retest the 1,115.4 level. As per classic market st
SHANTIGOL Weekly Breakout Above Key Resistance & Strong VolumeThe weekly timeframe for Shanti Gold International Limited.
Following a prolonged period of consolidation and recovery from the 170 levels earlier this year, the stock has staged a decisive breakout above a major horizontal resistance zone.
Technical Analysis:
Price Action: The price has cleanly broken and closed above the critical resistance line at 271.35, a level that previously acted as a strong supply zone in August/September.
Volume Validation: The breakout is supported by a significant
ARTEMISMED Weekly Breakout with Massive Volume SurgeArtemis Medicare Services Ltd. has formed a highly bullish technical setup on the weekly timeframe.
The stock recently broke out above a critical horizontal resistance line at the 343.50 level.
This breakout is validated by a massive, anomalous spike in trading volume, indicating strong institutional accumulation and high conviction behind the move.
Following a prolonged period of volatility and basing, this price action suggests a structural shift in momentum.
The previous heavy resistance
SHADOWFAX : Bullish Rectangle Breakout with Volume ConfirmationTrade Bias: Long
Chart Analysis:
As observed in Shadowfax Technologies has spent several weeks consolidating within a clear rectangular channel, bounded by support around 240.00 and resistance near 264.00.
The most recent daily price action demonstrates a definitive breakout above this resistance zone, printing a strong, full-bodied bullish candle that closed at 272.45 (+8.31%).
To satisfy the requirement of multiple technical confirmations, this pattern breakout is heavily supported by a ma
Nifty Intraday Analysis for 14th October 2026NSE:NIFTY
Index is overbought and expected to cool down to 22600 - 22550 range, however, upside momentum is expected to continue as long as Index is above 22500 support level. On the down side, if the Index breaks down 22500 support level then further downside risk opens.
The upward movement may lead to 22950 – 23000 resistance range and if the index crosses and sustains above this level then may reach near 23200 – 23250 range.
On the contrary, The downward moment may drag the Index to 2
PRADPME Bull Flag Breakout Validated by Historic VolumePradeep Metals Limited is demonstrating a classic bullish continuation setup on the daily timeframe.
After a strong initial rally from the 380 levels up to 600 (forming the flagpole), the stock entered a multi-month consolidation phase within a well-defined descending channel.
The most recent price action shows a decisive breakout above the upper resistance line of this channel.
Crucially, this breakout is supported by a massive spike in volume (over 514K), which dwarfs the average daily vol
CAPLIPOINT Major Resistance Breakout and RetestCaplin Point Laboratories Limited on the weekly timeframe outlines a clear bullish continuation setup.
Chart Analysis & Rationale
Major Structural Breakout: As seen the price decisively broke above a long-standing horizontal resistance level at 2,636.3.
This marks a significant shift in the broader market structure.
Volume Confirmation: The upward momentum that pushed the price through the 2,636.3 line was accompanied by a noticeable volume spike at the bottom of the chart, validating the stre
Fertile Ground for a Turnaround!Pattern Structure: The chart showcases a well-defined descending pattern, a structural formation where the white dashed line acts as a crucial hidden resistance level before the current price action.
Volume Analysis: A significant surge in buying volume propels the breakout, serving as a vital confirmation and protecting traders from potential false breakouts.
Supply and Demand Flip Zone: Observe the transition zone: an initial demand area that turned into resistance, and has now been reclaime
Level is not breached yet! Great Recovery seen!AS we can see NIFTY recovered sharply as it could not break the consolidation which we expected. Also, the 22200 level is still protected. Hence, we will stand by our analysis that until the consolidating is broken below, every dip can be bought. So, plan your trades accordingly and keep watching everyone.
Nifty - Expiry day analysis Oct 13Today, the price opened at the important zone 22600 and was unable to sustain above it and fall. The price can find support in the 22300 - 22320 zone or in the 22180 - 22220 zone. Breaking or showing bearish strength at the 22180 - 22220 zone can lead to a big fall, as it is a crucial level in deciding the trend direction.
Buy above 22420 with the stop loss of 22360 for the targets 22480, 22520, 22560, 22600 and 22660.
Sell below 22280 with the stop loss of 22340 for the targets 22220, 22180, 2
SKYHINX — Demand Zone Setup (Daily Chart)A potential bullish reversal opportunity is developing at a key daily demand zone.
📊 Market Structure
After a significant bearish move, price has returned to a historically important demand area where buyers may attempt to regain control.
The focus is on how price reacts around this zone and whether bullish confirmation develops.
🎯 Key Levels
Demand Zone: 1,060–1,100
First Target (TP1): 1,220–1,240
Major Resistance Zone: 1,400–1,440
Invalidation: 972.41
📈 Trade Thesis
The setup is base
Nifty Intraday Analysis for 13th October 2026NSE:NIFTY
Index is above 22300 - 22200 support range and the support level is expected to be respected if Index drags and this support is broken then further downfall is expected. On the upside, Index has resistance near 22500 - 22600 range and reversal of trend is expected when Index breaks and sustains above 23000 level.
The upward movement may lead to 22575 – 22625 resistance range and if the index crosses and sustains above this level then may reach near 22850 – 22900 range.
On the c
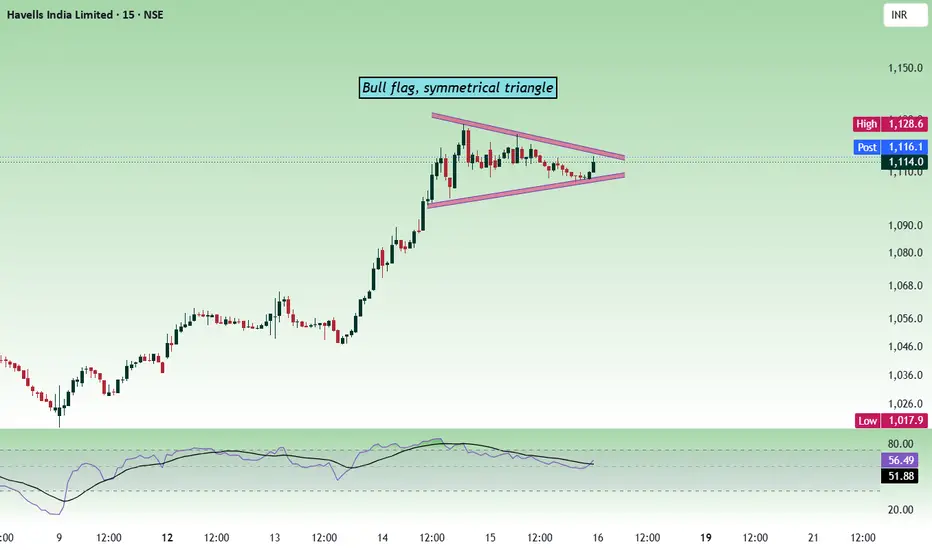
Havells - Multi time frame analysisIn the lower timeframe, the price is forming a symmetrical triangle. We can also see a bull flag formation. A symmetrical triangle is a neutral pattern, and the breakout can be in any direction. A bull flag is a bullish pattern.
On the daily timeframe, the price is forming a W pattern, which is bullish.
The price is bullish as long as it stays above 1082 - 1088.
Buy above 1110 - 1114 with a stop-loss of 1094 for the targets 1122, 1136, 1148, 1162 and 1176.
The price can face resistance at the 1