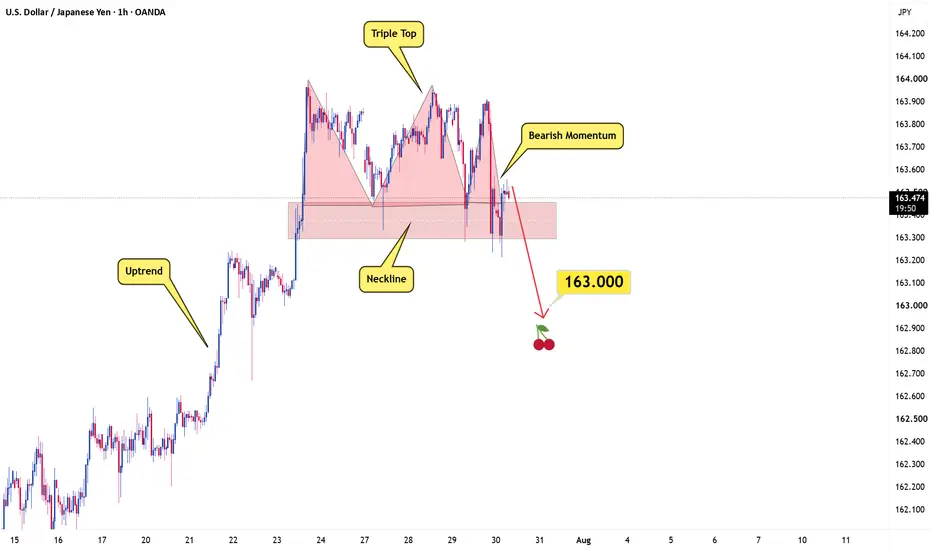
USDJPY Forms a Clear Triple Top PatternUSDJPY has formed three distinct highs around the same resistance area, creating a clear triple top structure. Each attempt to move higher was rejected, showing that buyers are losing momentum while sellers continue to defend the upper zone.
Price is now approaching the support beneath the pattern. A decisive break and close below this area would confirm the triple top and increase the probability of further downside toward 163.000.
Until that support is broken, the pattern remains unconfirmed
Forex-trading-signals
EURUSD At Support - High probability reversalOANDA:EURUSD The pair has experienced a sharp decline and is now approaching an important support zone.
Notably, there is still an unfilled gap below the current price. Therefore, I expect price may continue to pull back and fully fill this gap before forming a more sustainable recovery. If the gap is filled, followed by a clear bullish rejection while price holds above support, buying pressure could return and push the pair toward the 1.14350 target.
On the other hand, if price breaks through
EUR/USD: Support respected, another opportunity emergesThe EUR/USD chart reveals an interesting technical structure, where market positioning and price behavior are aligning around a key demand area. The focus of this setup is the support zone, a well-established region that has repeatedly attracted buying interest and prevented further downside, showing that buyers are actively defending this level.
Price action around this area reflects a gradual absorption of selling pressure. Each return toward the support zone has been met with a responsive re
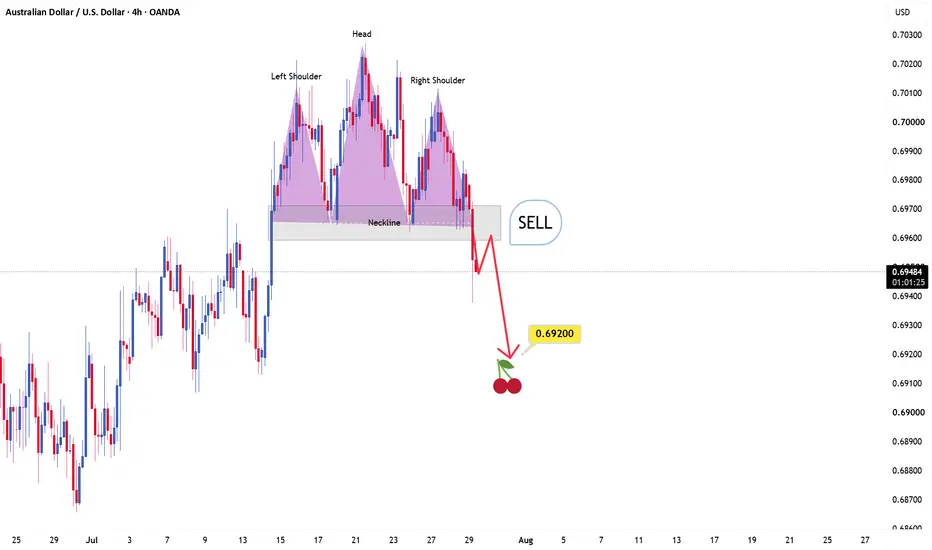
AUD/USD 4H Chart — A Bearish Reversal Setup Is Taking ShapeThis is my AUD/USD 4-hour chart and this is how I see the current structure. After a strong move higher, price is now showing signs of exhaustion and has started forming a potential Head and Shoulders reversal pattern.
The left shoulder, head, and right shoulder are clearly visible, but the setup is not confirmed yet. The key level to watch is the neckline support. I want to see a strong break and a candle close below this area before considering any sell opportunity.
If the neckline breaks succ
XAU/USD Update: Gold Breaks the Downtrend — Buyers Are BackGold has been trading inside a clear downtrend, with price repeatedly being rejected by the descending trendline, creating strong selling pressure over the past sessions.
However, after reaching lower levels, selling pressure started to weaken and price began showing early signs of a structural shift. The most notable move came when Gold broke strongly above the descending trendline, suggesting that buyers are starting to regain control in the short term.
At this stage, I am watching for a pote
XAGUSD breaks below a symmetrical triangleXAGUSD just broke below a symmetrical triangle pattern. This type of pattern forms when price creates a series of lower highs and higher lows, causing the market to compress between two converging trendlines.
This kind of formation reflects a period of indecision, where buyers and sellers are fighting for control. As the range becomes tighter, pressure builds and increases the probability of a strong breakout.
By itself, the symmetrical triangle is a neutral pattern, but context matters A LOT.
GBPUSD Tests Key Support: Buyers Eye a Recovery Toward 1.3350GBP/USD is approaching a critical demand area where buyers have previously stepped in and defended the market. This zone also sits around the key psychological level of 1.32000, making it a region that could attract significant attention from traders.
After the recent recovery, price action suggests that selling pressure is starting to weaken, creating the possibility of another bullish reaction from this area. However, buyers still need to prove their strength. A clear rejection from support,
XAUUSD: Double Bottom Forming – Is a Reversal Coming?Gold has been under pressure for several weeks, moving lower with strong bearish momentum.
But recently, price started to stabilize around the 4,000 support zone, creating two similar lows. This structure is beginning to form a potential Double Bottom pattern — one of the most watched reversal patterns in technical analysis.
At first glance, this looks like a sign that sellers are losing control.
However, a Double Bottom is not confirmed simply because two lows appear on the chart. The key le
EUR/USD: Stronger discounts continue!Hello dear friends! What do you think about the current trend of EURUSD?
Today, EURUSD continues to decline, seemingly trying to gather strength to bounce back as the US dollar strengthens for the third consecutive day.
Currently trading near the 1.0849 level, a quick look at the technical analysis chart shows that the downward momentum is still leading. As a result, breaking below the support level of 1.0871 has solidified the case for implementing a selling strategy.
I am watching the 1.080