GRAPHITE: Multi-Year Ascending Triangle Breakout to Fill the Mac1. The Macro Perspective: The Boom, The Bust, and The Base
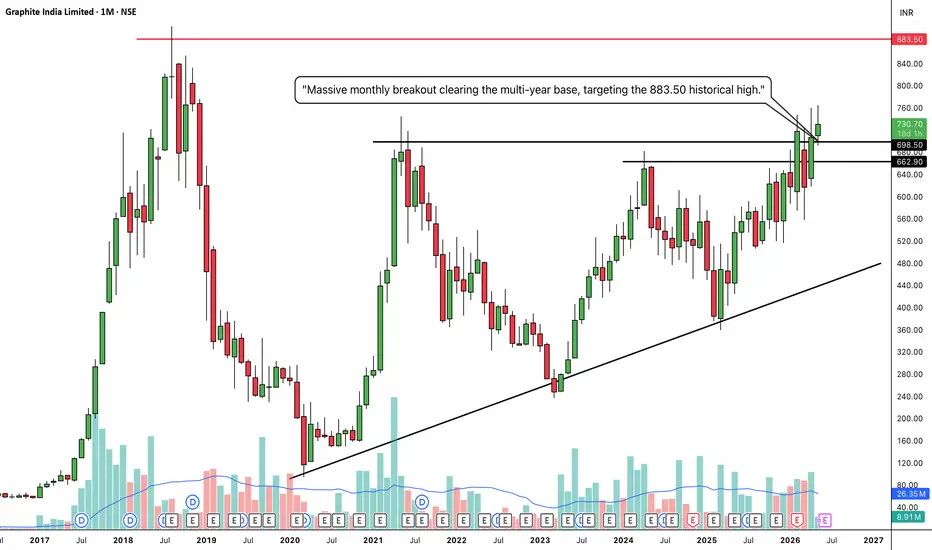
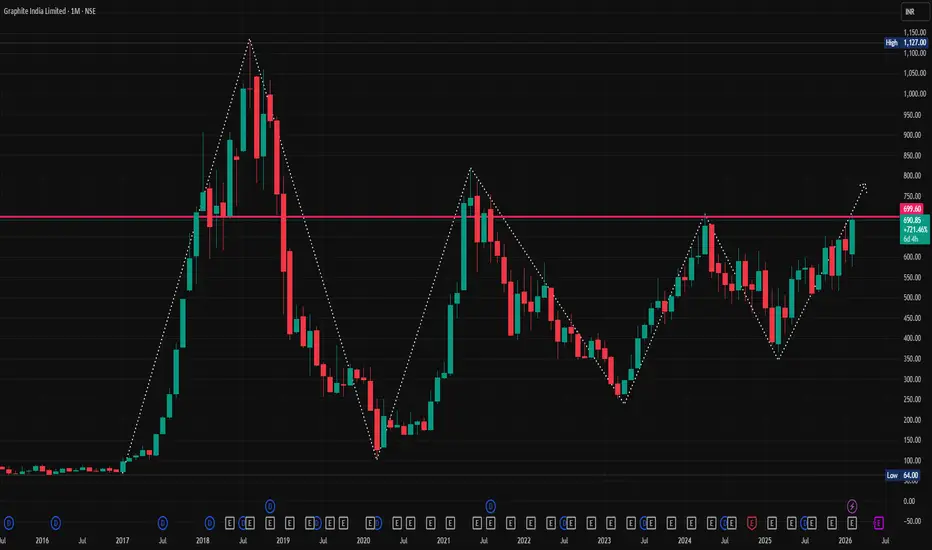
I am taking a LONG bias on Graphite India Limited (GRAPHITE) on the absolute macro monthly (1M) timeframe.
When analyzing pure market structure on a monthly chart, we are looking at the true footprints of heavy institutional capital playing out over years. Look at the massive structural development on this chart. In 2018, the stock established its ultimate historical ceiling at the solid red 883.50 line. What followed was a brutal, mult
GRAPHITE
HEG LimitedAsset: HEG Limited (NSE: HEG)
Timeframe: 1 Day (Daily)
Pattern: Parallel Channel
HEG is currently trading within well-defined parallel lines on the daily chart. Price has respected both the upper resistance line and the lower support line multiple times, confirming the strength of this channel.Trading Plan:Bullish Scenario: Look for a strong daily candle close above the upper resistance line for a breakout trade.
Bearish Scenario: If the price rejects the upper boundary, it may retest the lowe
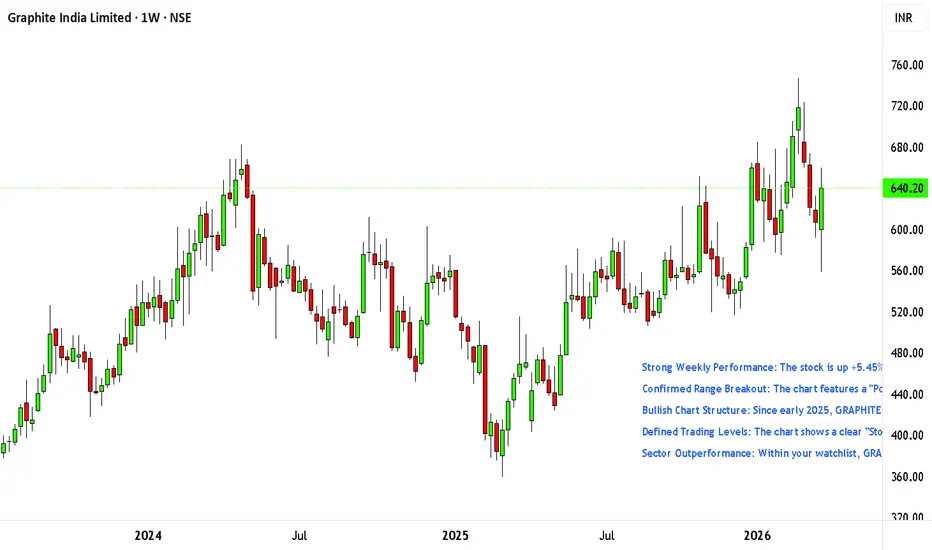
#GRAPHITEStrong Weekly Performance: The stock is up +5.45% for the week (currently at 640.20), showing significant recovery from its weekly low of 558.05.
Confirmed Range Breakout: The chart features a "Positional Swing" note pointing to a Range Breakout above the 580 level; the price is now comfortably holding above this previous resistance, which has turned into support.
Bullish Chart Structure: Since early 2025, GRAPHITE has transitioned from a downtrend into a steady uptrend, characterized by "high
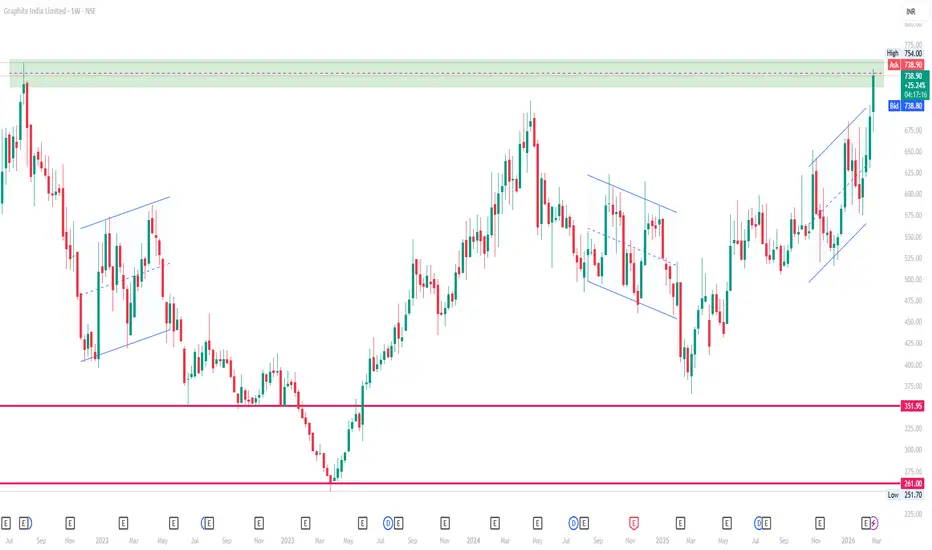
Graphite India Ltd Weekly Chart๐ Current Price (Approximate)
โน737โโน741 per share (latest trading level on NSE).
๐ Weekly Timeframe Key Levels (Support / Resistance)
๐น Weekly Pivot Zone
Central Pivot (Weekly) ~ โน675โโน676 โ midโpoint reference for weekly trend.
๐ฅ Resistance Levels (Upside Targets This Week)
R1: ~ โน720โโน725 โ first resistance above pivot/weekly range.
R2: ~ โน745โโน750 โ moderate resistance where price could slow.
R3: ~ โน770โโน795+ โ extended target if bullish momentum continues.
Interpretation:
Above โน745
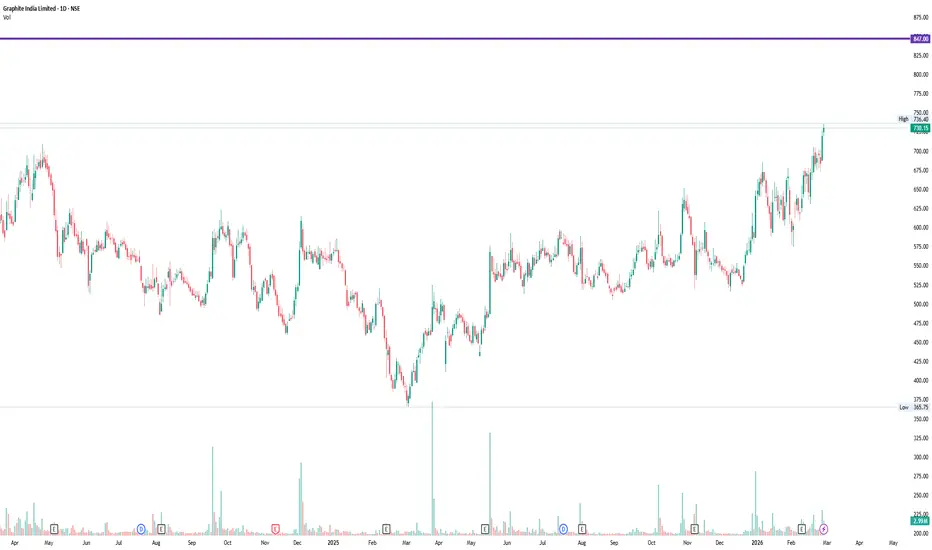
#GRAPHITEGRAPHITE @ 26.02.26 : 730.15
SL: 683
Target:847
NOTE:
The stock price, entry, stop-loss (SL), and target levels shared are strictly for educational and observation purposes only.
This is not investment advice. Please do your own research or consult a registered financial advisor before making any trading or investment decisions.
Market investments are subject to risk.
Graphite India Limited Monthly Chart ๐ Latest Price Context
๐ Current price: ~โน690 - โน695 per share (recent sessions) โ near 52-week high (โน705) with positive momentum on the monthly view.
๐ช Expanded Levels for the Last Month
(from wider pivot / Fibonacci methods)
Retracement Supports
~โน660
~โน635
~โน610
Extension / Breakout Resistances
~โน733
~โน760
Longer breakout target: ~โน780 + (if above โน723)
These give potential continuation zones if the stock sustains above higher resistance levels.
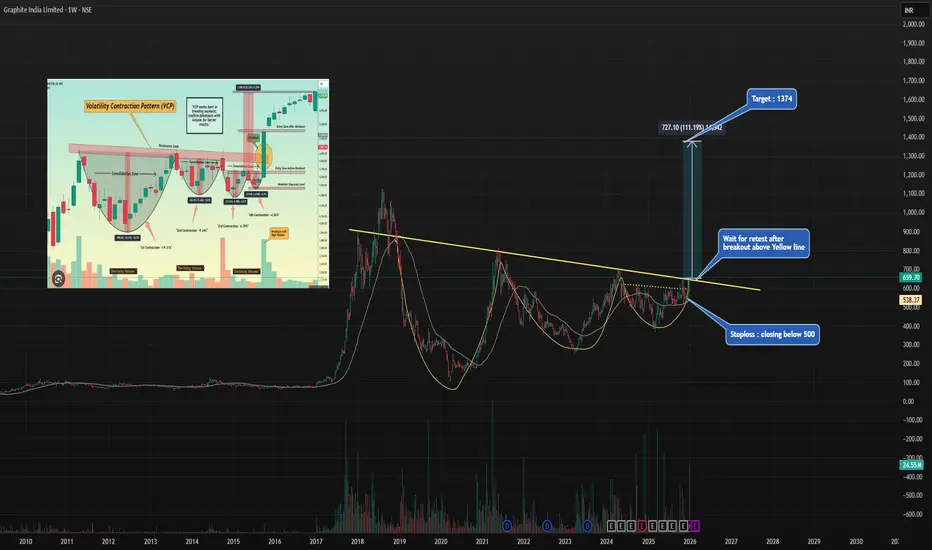
Graphite India : VCP pattern ! Money may Double in 1.5 YearsHi Friends,
Graphite India looks promising now after ~08 years of time & price wise correction period. I am anticipating the stock to start its upward journey.
Chart Pattern : VCP
Targets, Stoploss & Entry price is mentioned in the chart .
Please feel free to share your views regarding this chart & analysis .
Note : I am not a SEBI registered advisor . Please consider my analysis only for Education purpose .
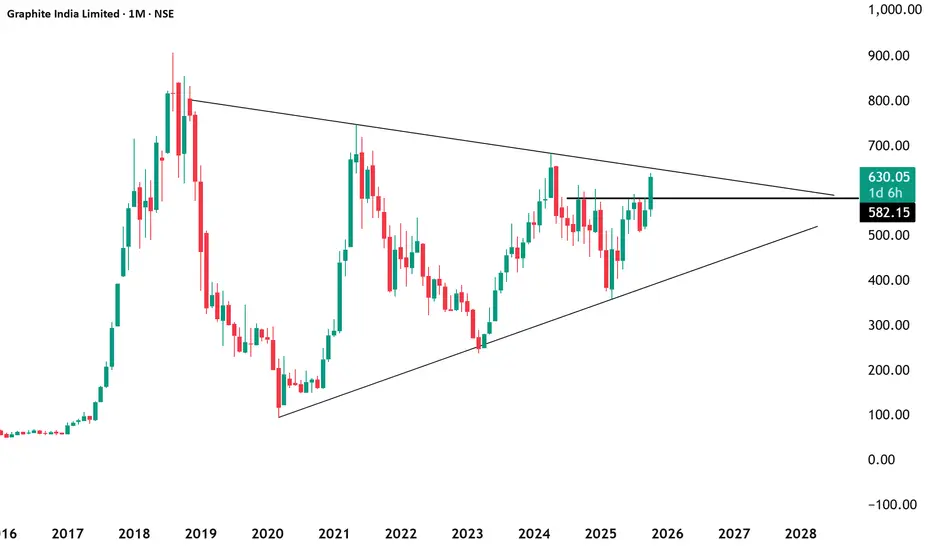
nderstanding Symmetrical Triangle Breakout in Grahipte India Ltd๐ Understanding Symmetrical Triangle Breakout in Grahipte India Ltd
Grahipte India Limited, currently trading near โน438 on the monthly chart, has recently shown a sustained bullish breakout from a symmetrical triangle pattern. This setup is a classic continuation signal in technical analysis, especially when it occurs within an established uptrend. Letโs break down the concept, its importance, and the current opportunity with risk management considerations.
๐บ What is a Symmetrical Triangle Pat
Graphite India: Sparking the Next Electrode UpswingNSE:GRAPHITE
Company snapshot
Indiaโs largest graphite electrode manufacturer; also produces specialty graphite, impervious graphite equipment, GRP pipes and high-speed steel.
Capacity of ~98,000 TPA across plants at Durgapur and Nashik; Germany plant closed. Utilisation stood at ~83% in FY25.
Investing in advanced carbon technologies; announced ~25,000 TPA capacity expansion (~123,000 TPA target).
Market context
Rising share of electric-arc-furnace (EAF) steel globally support
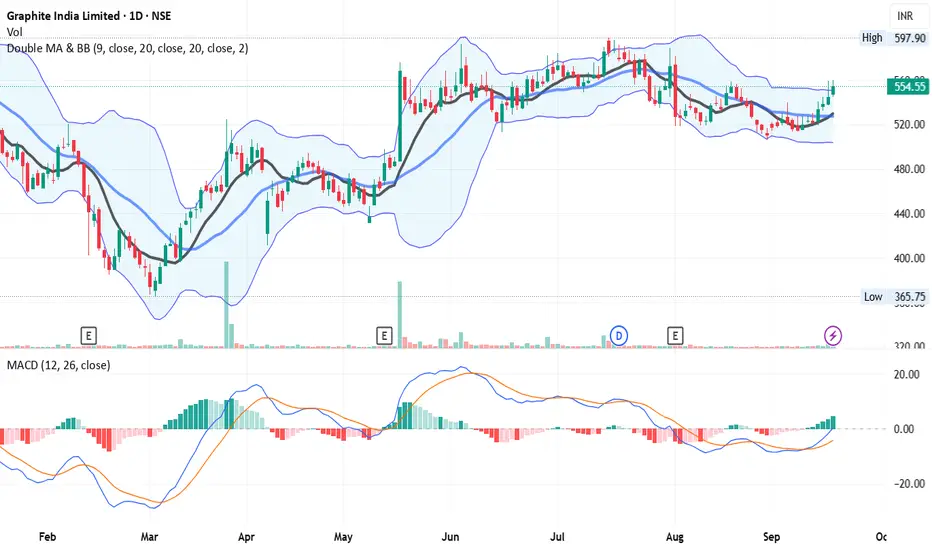
Breakout - Looks Good On Chart - GRAPHITE๐ Script: GRAPHITE
๐ Industry: Industrial Products (Electrodes & Refractories)
Key highlights: ๐กโก
๐ Script is trading at upper band of BB.
๐ MACD is giving crossover .
๐ Crossover in Double Moving Averages.
๐ Right now RSI is around 63.
๐ One can go for Swing Trade.
๐ In Monthly Chart It Script is forming Symmetrical triangle and about to give breakout, we can see good rally in future.
โฑ๏ธ C.M.P ๐๐ฐ- 555
๐ข Target ๐ฏ๐ - 578 / 597
โ ๏ธ Stoploss โ ๏ธ๐ซ - 539
โ ๏ธ Important: Always maintain your Risk
Graphite India cmp 521.60 by Monthly Chart view*Graphite India cmp 521.60 by Monthly Chart view*
- Support Zone 455 to 490 Price Band
- Stock Price is well above the EMA 21, 50, 100, 200
- Stock Price has tested retested Support Zone well enough for Fresh Breakout
- Weekly Support at 445 > 380 > 310 with Resistance at 595 > 670 > 740 > ATH 815.90
- *Monthly Stock Chart indicative of good probability for a Fresh Upside Breakout basis Multiple Test Retest of the Support Zone*
Graphite India Ltd - Breakout OpportunityDate : 24-Sep-2024
LTP : Rs. 598.15
Resistance Levels: (R1) Rs. 709 --> (R2) Rs. 815
Support Levels : (S1) Rs. 495
Technical View:
โข NSE:GRAPHITE is in strong primary uptrend and was recently going through it's secondary downtrend within primary uptrend.
โข After touching the high of 709.40 on 25-Apr-2024, it has retraced 32% to 485.15 level.
โข NSE:GRAPHITE has breakout from it's secondary downtrend with higher than average volume. Breakout is also supported by increased volume in last
Just A View - GRAPHITE๐ Script: GRAPHITE
๐ Sector: Capital Goods-Non Electrical Equipment
๐ Industry: Electrodes - Graphites
Key highlights: ๐กโก
๐ Script is trading near at Neckline of Double Dottom on Monthly Chart.
๐ One can go for Risky Swing Trade for 66 points till resistance which is 755.
๐ Safe trader can buy only above 755.
BUY ONLY ABOVE 755
โฑ๏ธ C.M.P ๐๐ฐ- 688
๐ข Target ๐ฏ๐ - 939
โ ๏ธ Important: Always maintain your Risk & Reward Ratio.
โ
Like and follow to never miss a new idea!โ
Disclaimer: I am not SEBI Re
Graphite breakout on a weekly timeframeThe stock is exhibiting positive technical signals by trading above both the 20-day and 50-day Exponential Moving Averages (EMA). This suggests that the stock is experiencing upward momentum in the short and medium term. The crossover of the 20-day EMA above the 50-day EMA may indicate a potential bullish trend. The relatively low Price-to-Earnings (PE) ratio of 11.76 compared to the sector is a positive fundamental aspect. This could indicate that the stock is attractively valued, potentially p
GRAPHITE - Weekly chart, Reversal SetupThe analysis is done on Weekly TF hence price may take few weeks to few months in order to reach the targets. Trade setup is explained in image itself. This is a continuation breakout chart.
The above analysis is purely for educational purpose. Traders must do their own study & follow risk management before entering into any trade
Checkout my other ideas to understand how one can earn from stock markets with simple trade setups. Feel Free to comment below this or connect with me for any query
Graphite India Limited - Long Setup, Move is ON...#GRAPHITE trading above Resistance of 494
Next Resistance is at 615
Support is at 344
Here is previous chart:
Chart is self explanatory. Entry, Resistances and Support are mentioned on the chart.
Disclaimer: This is for demonstration and educational purpose only. This is not buying or selling recommendations. I am not SEBI registered. Please consult your financial advisor before taking any trade.
Breakout in Graphite India Limited...Chart is self explanatory. Levels of breakout, possible up-moves (where stock may find resistances) and support (close below which, setup will be invalidated) are clearly defined.
Disclaimer: This is for demonstration and educational purpose only. This is not buying or selling recommendations. I am not SEBI registered. Please consult your financial advisor before taking any trade.
GRAPHITEGRAPHITE:- Wait for breakout, upside movement may be seen
Hello traders,
As always, simple and neat charts so everyone can understand and not make it too complicated.
rest details mentioned in the chart.
will be posting more such ideas like this. Until that, like share and follow :)
check my other ideas to get to know about all the successful trades based on price action.
Thanks,
Ajay.
keep learning and keep earning.