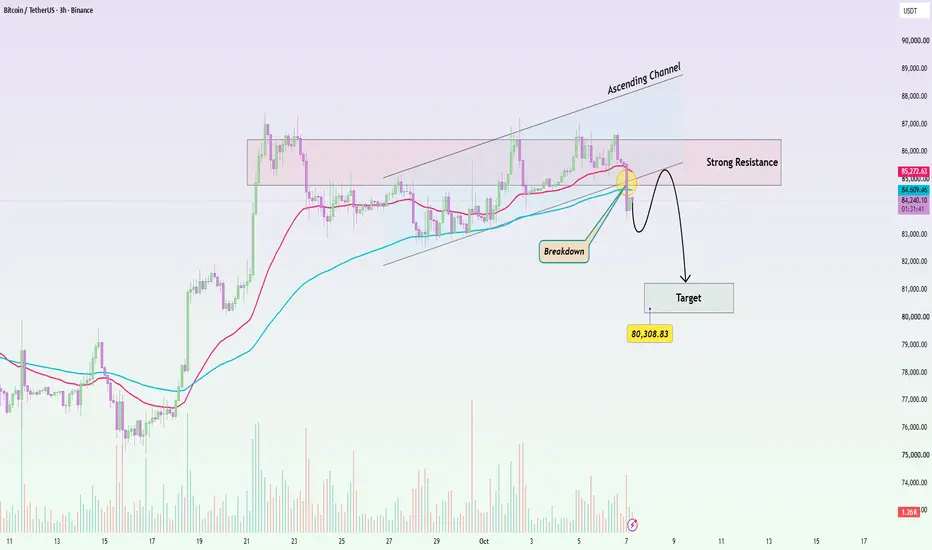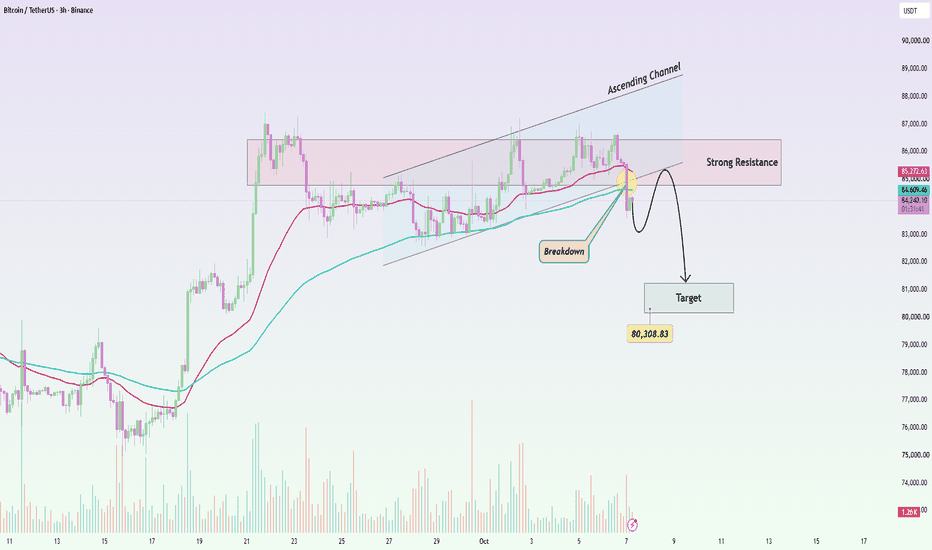
BTCUSDT: Channel Breakdown Turns Into ResistanceBitcoin has broken below the lower boundary of its ascending channel, and price is now trading around $84,200, below both short-term EMAs. That weakens the previous bullish structure and shifts attention toward a deeper correction.
The important area is now roughly $84,600–$86,300. This zone previously supported the advance, but after the breakdown it can become resistance.
If BTC rebounds into this area and fails to reclaim the channel, I would treat that move as a retest rather than a bullis
Grmoverseastechnicalchartsetup
Anand Rathi Wealth: Wave 5 Ahead or Bigger Wave (4)?From the March 2025 low of 797, this stock has almost tripled. The move fits a clean Elliott Wave structure.
Wave (1) and (2): Wave (1) ran from 797 to 1,660.7. Wave (2) fell to 1,353.9, taking back only 35.5% of wave (1). That's a shallow dip, which shows buyers stayed strong.
Wave (3) so far: Inside wave (3), wave 1 topped at 1,620.5 and wave 2 fell to 1,451.5. Wave 3 then ran to 2,268.4, about 3 times the size of wave 1, in five smaller waves: ⓘ to ⓥ. Wave 4 ended at 2,007.
Why the co
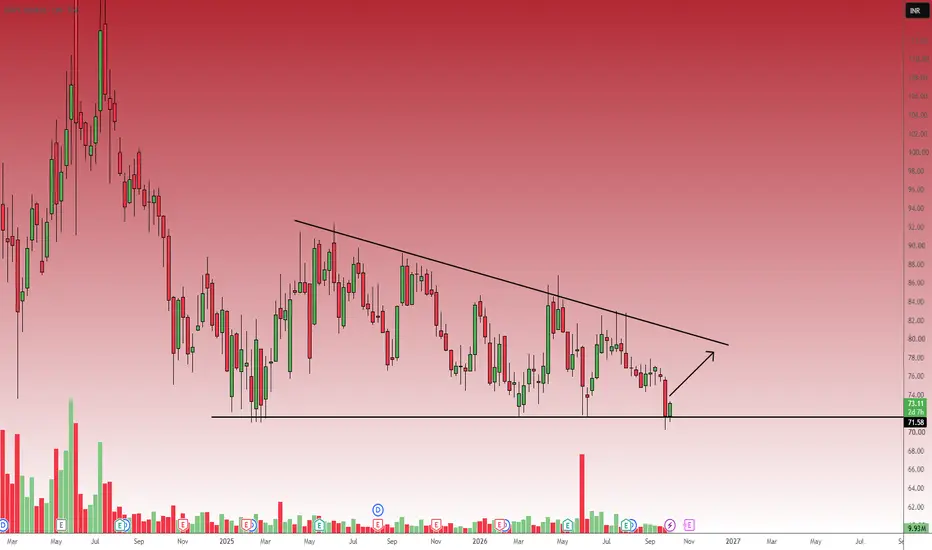
NHPC High Risk:Reward Rebound from Major Horizontal SupportBased on the weekly timeframe NHPC is currently at a critical technical juncture, compressing within a large structure bounded by declining highs and a flat support base.
Chart Analysis:
Major Support: The stock has established a highly resilient horizontal support zone around the 71.50 - 72.00 level (marked by the black horizontal line at 71.58).
The price has tested this floor multiple times over the past several months, and we are currently seeing a fresh bounce forming a bullish weekly can
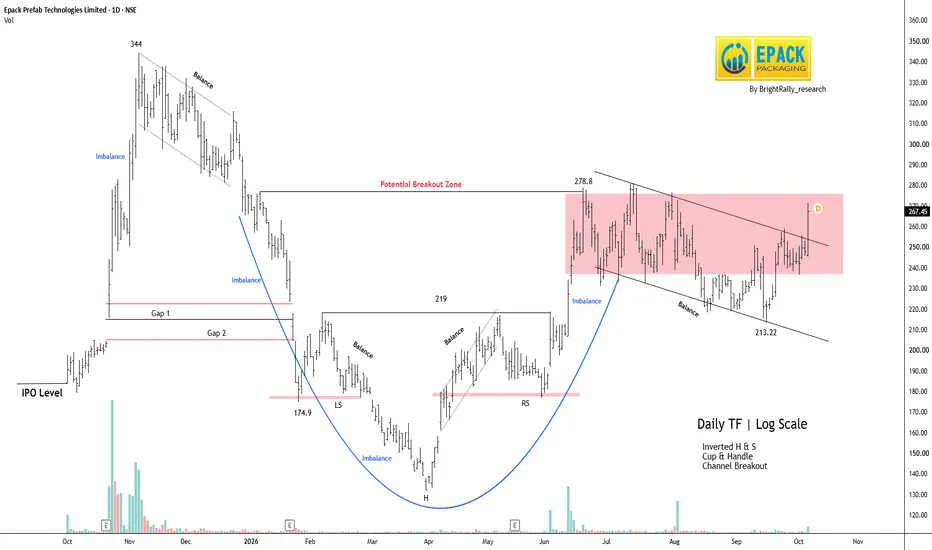
EPACKPEB: Bullish Breakout Setup, 278.8 Is the Key TriggerShort Term levels: 286 and 314
Intraday Support: 260
NSE:EPACKPEB is showing strong bullish momentum after breaking above the recent channel. Price is now near 267, with buyers clearly in control. The main hurdle is 278.8; a clean breakout can strengthen the move. Volume expansion would add confidence to the breakout.
On the downside, 250 is the first important support to watch. As long as price holds above this area, the bullish setup remains intact. A move below 240 would weaken the struc
BHEL Strong Ascending Triangle BreakoutBased on the daily chart for Bharat Heavy Electricals Limited provided a clear bullish setup has materialized.
Technical Analysis & Reasoning:
Ascending Triangle Pattern: Since early June, the price action has steadily compressed, printing a series of higher lows along a well-defined, upward-sloping support trendline.
This accumulation pushed the price into a rigid horizontal resistance zone right at the 439.90 mark.
Confirmed Breakout: The most recent daily session resulted in a massive bulli
Urban Company (D): PATTERN BREAKOUTTimeframe: Daily | Chart Scale: Linear
Explosive +8.74% surge today backed by a massive 23.98M volume spike! 🔥
Technical Highlights:
✅ Chart Pattern: Decisive breakout from a descending triangle consolidation.
✅ Volume Reversal: Volume rising over the past couple of days, breaking a recent dry spell.
✅ Momentum: Weekly EMAs in positive crossover. MACD & RSI rising (Daily/Weekly). 🚀
Key Levels to Watch:
🎯 Target: 183
🛡️ Support / Pullback: 169 (Previous triangle resist
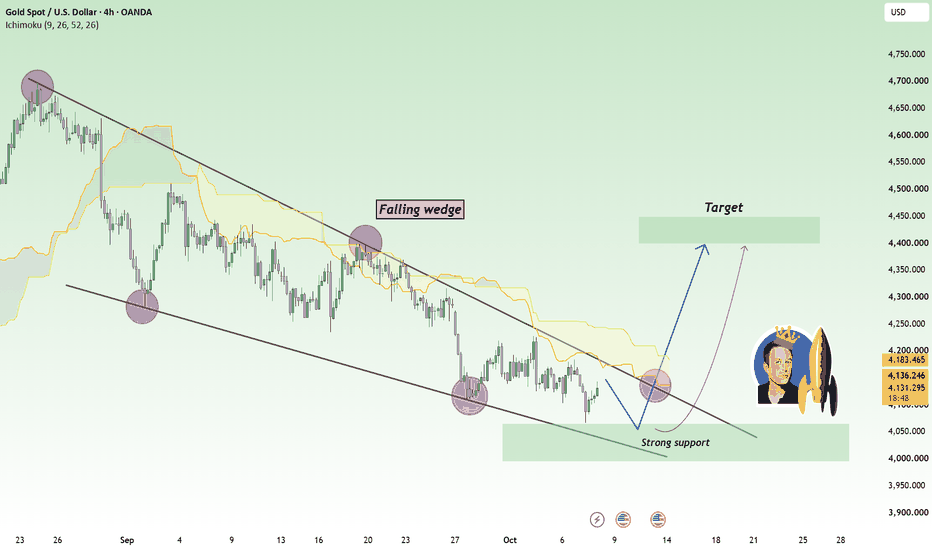
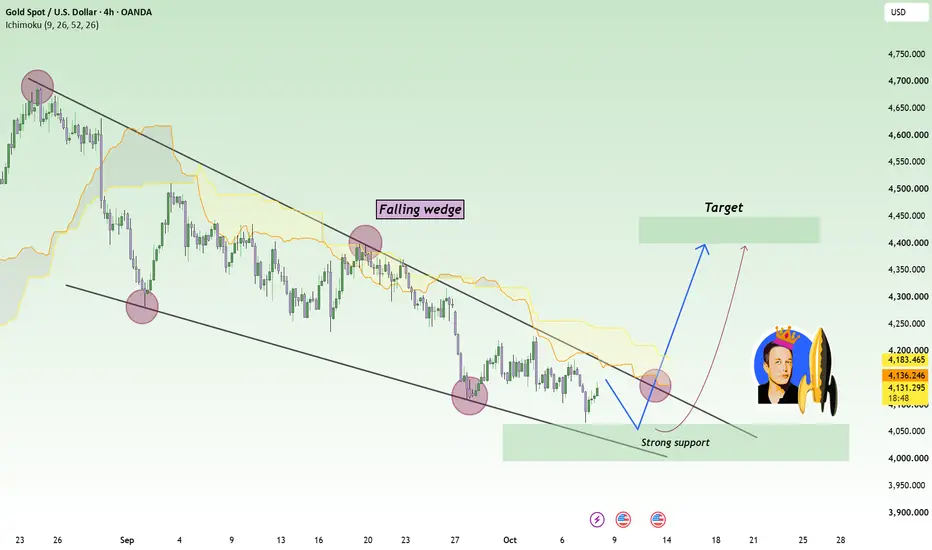
XAUUSD – Falling Wedge Keeps the Recovery Setup AliveXAUUSD is beginning to show a more constructive setup on the H4 timeframe. Price is still trading inside a broader falling wedge, but the latest reaction from the lower boundary suggests that selling pressure is becoming less effective as Gold approaches a major support area. The current move may still need another pullback, but the structure is starting to favor a recovery rather than an extended sell-off.
From a fundamental perspective, the picture is mixed. A firm U.S. dollar, elevated Treas
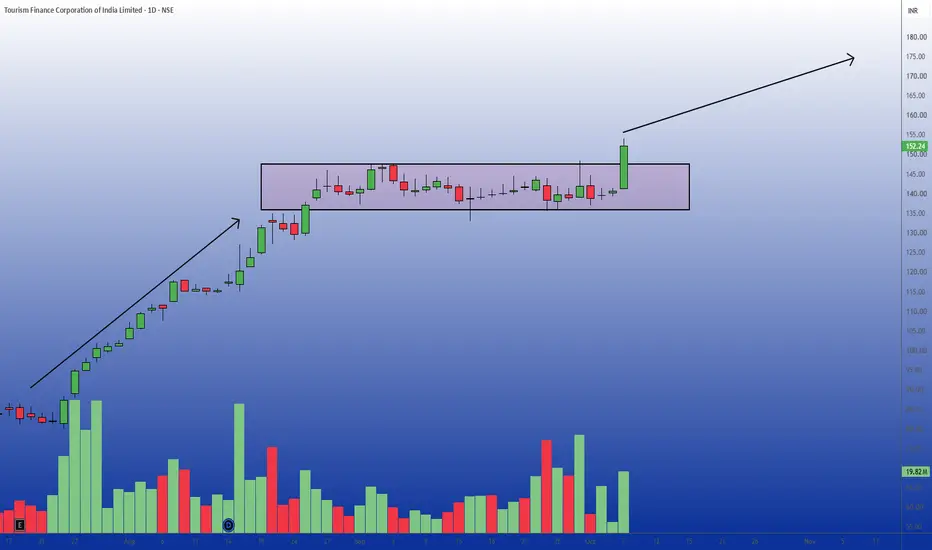
TFCILTD Bullish Breakout from Consolidation Phase on DailyOn the daily timeframe, Tourism Finance Corporation of India Limited has demonstrated a strong preceding uptrend, rallying significantly before entering a period of sideways movement.
Over the past several weeks, the price has been consolidating within a well-defined rectangular box, bouncing between structural support near 135 and resistance near 146-147.
In the most recent trading session, a strong bullish candle broke out above the upper boundary of this consolidation zone, closing at 152.2
Watch CP PLUS NSE:CPPLUS was consolidating for 4-5 months in the tight range after breaking out of 2500 levels and moving 30%+ quickly.
Now after this long consolidation again breaking out. All time high is around 4000 levels. So keep a close watch for these levels
Even though market condition is not favourable we are finding opportunities like this in few counters. We have to be very careful when broader market is this bad.
Notably IPO index is doing very well for sometime now.
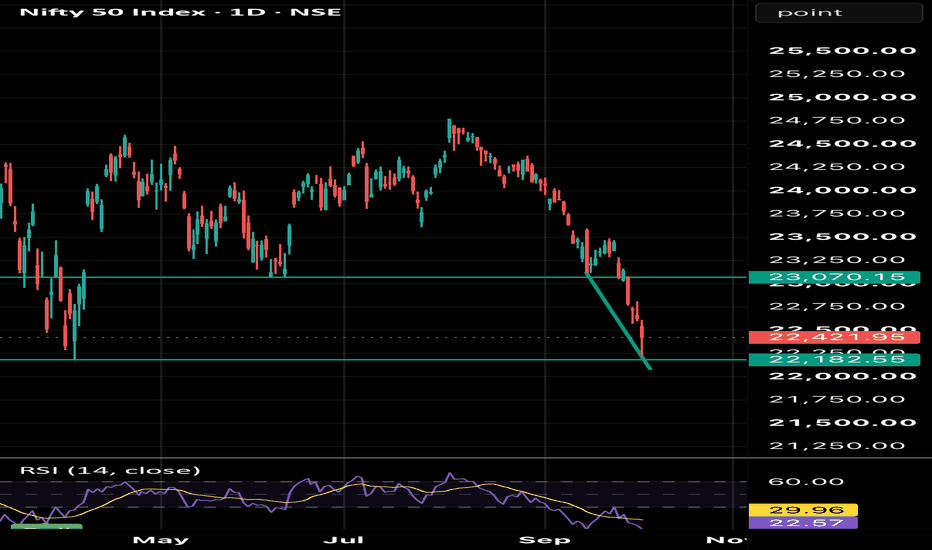
Nifty Pull BackA month long fall can se a pull back
A trend reversal in NSE:NIFTY can be possible till 23070. A double bottom support, last-minute buying on Thursday, and a negative divergence are the supporting factors.
"Disclaimer: The content shared here is for informational and educational purposes only and is not intended to be investment or trading advice. Trading and investing in stocks involves substantial risk of loss. Past performance does not guarantee future results. Please conduct your own
Aequs Ltd (W): ALL-TIME HIGH BREAKOUTTimeframe: Weekly | Chart Scale: Logarithmic
Explosive +11.79% weekly surge hitting a new ATH of 285.95! 🔥
Technical Highlights:
✅ Breakout: Cleared & closed above short-term horizontal resistance (active since Jul '26), breaking out of a sideways trend.
✅ Volume: Massive 62.06M volume backing the move. Overall volume trend is steadily rising!
✅ Momentum: Short-term EMAs in positive crossover (Daily/Weekly). MACD & RSI rising. 🚀
Key Levels to Watch:
🎯 Target: 340
🛡️ Su
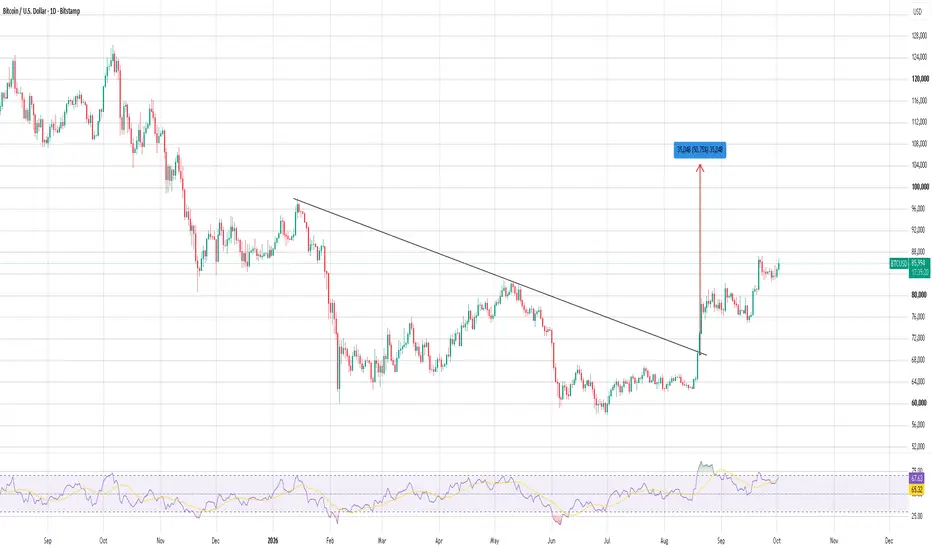
Bitcoin — Daily ChartBitcoin has formed a Double Bottom around the $60,000–$64,000 area. The neckline was broken decisively and the subsequent retest has already been completed, with price holding above the breakout zone.
The breakout also came with strong momentum, and price has moved above the long-term falling trendline. This strengthens the bullish structure.
Current price is around $85,940.
The measured move from the Double Bottom projects approximately $104,000, which is the major pattern target marked on
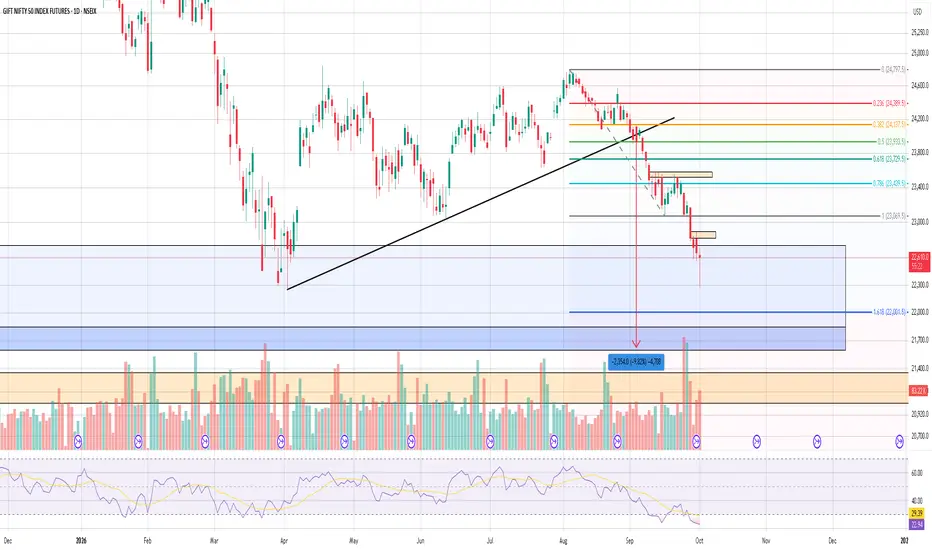
GIFT Nifty – Daily ChartGIFT Nifty has formed a Double Top near 24,800, followed by a breakdown of the neckline and continued selling. The failed retest around 23,400–23,500 adds strength to the bearish setup.
The Fibonacci levels also support the downside:
0.786 Fib: 23,439 – now resistance
1.0 Fib: 23,070 – important broken level
1.618 Fib: 22,001 – first major downside target
2.618 Fib: around 20,275 – extended target
Price is currently around 22,610, below the 1.0 Fib level. Unless 23,070–23,400 is reclaimed,
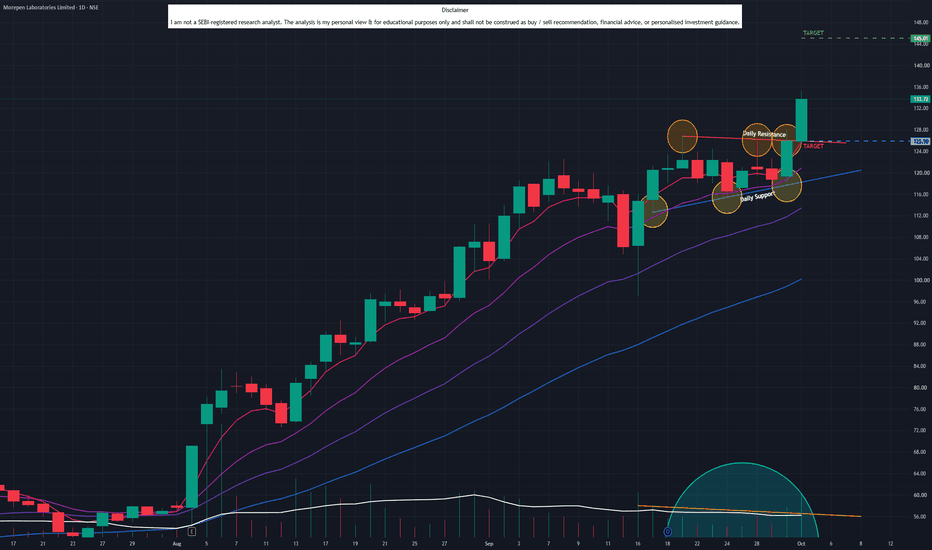
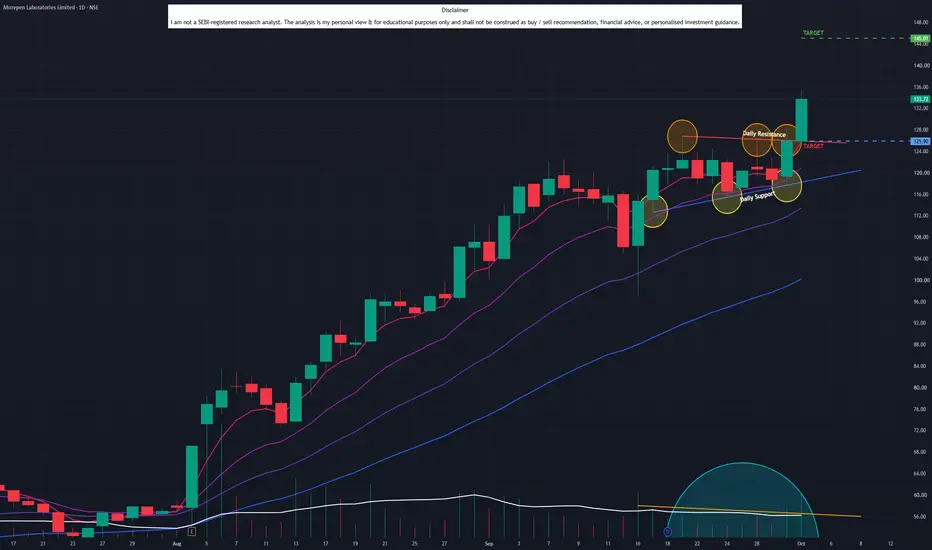
Morepen Laboratories (D): CONTINUATION BREAKOUTTimeframe: Daily | Chart Scale: Linear
Explosive +6.14% surge today backed by a massive 37.97M volume spike! 🔥
Technical Highlights:
✅ Chart Pattern: Textbook "Flag & Pole" breakout confirming the broader uptrend!
✅ Volume Reversal: Sudden, massive volume spike violently breaking a recent "dry volume" phase.
✅ Momentum: Short-term EMAs in positive crossover (Daily/Weekly/Monthly). MACD & RSI rising. 🚀
Key Levels to Watch:
🎯 Target: 145
🛡️ Support / Pullback: 125 (Prev
NAS100 / USTEC - Flag Pattern – A Simple Bullish ScenarioSetup No. 1
In our previuos setup posted today, our flag was drawn with the triangle cloth. Now the redrawn flag is still puting us on the Buy Side but earlier than before.
Now we will take the buy limit order at 30005.4 with 1 to 1.17 risk to reward ratio.
Bullish Cases:
Flag pattern on 4H timeframe indicates a good Bullish scenario.
A good flag pattern on weekly timeframe is already in play.
1H Timeframe is in consolidation mode where the potential breakout of Triangle is likely t
Sensex - Expiry day analysis Oct 1Price is trading inside an ascending channel and is now testing the channel's support line. If support holds, price could rise toward the channel's resistance.
Buy above 72,620
Stop loss: 72,480
Targets: 72,760 · 72,880 · 72,980 · 73,100 · 73,260
Sell below 72,300
Stop loss: 72,460
Targets: 72,160 · 72,020 · 71,860 · 71,720 · 71,580
As per the daily chart, support is at 72000.
Always do your analysis before taking any trade.
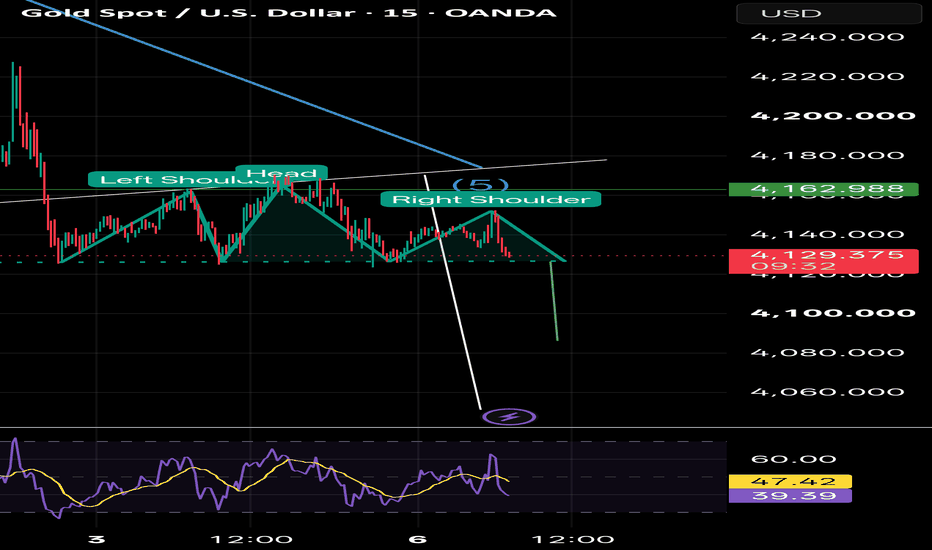
Gold with some more Bearish PotentialThe PEPPERSTONE:XAUUSD XAUUSD is still in good bearish mode as it is forming reverse Flag pattern on both hourly and 4H Time frame.
A breakdown below the pole of this flag patter will pave way to minimum of 3970 area.
In case id didn’t formed the bearish flag then a potential ABCD pattern is probable. As the price will be required with a 50% retracement on the current swing.
The second scenario will be traded latar. We will give a call on it if the ABCD pattern forms.
Currently we w
AUDNZD Bearish SetupAUDNZD is showing a potential bearish continuation setup after the rejection from the recent 1H highs.
The 4H structure remains bullish, but the 1H structure has turned bearish, with lower highs/lower lows and price trading below the 1H moving average.
The key area I'm watching is the 4H FVG formed on 22 September 2026.
Bearish Score:
Double Top with Bearish Divergence on 4H Timeframe.
Price is making lower highs and lower lows on the 1H chart.
Price is trading below the 1H moving ave
GIFT Nifty — Weekly Analysis - Alert The chart has formed a clear Double Top, followed by a neckline breakdown and retest rejection. This confirms a bearish technical structure.
🔻 Bearish Setup
Double Top neckline: around ₹24,000
Breakdown + retest: completed
Current price: ₹22,633
RSI: 32.67, showing strong bearish momentum.
🎯 Double Top Target:
The measured move shown on the chart projects approximately ₹18,650–₹18,700.
Key Levels:
Resistance: 24,000–24,300
Immediate support: 22,500–22,600
Next supports: 21,600 → 20,500
Tourism Finance Corp (TFCILTD) (D): ATH PUSH WITH CAUTIONTimeframe: Daily | Chart Scale: Linear
Hit a new ATH of 148.50 today with a massive 31.9M volume spike! 🔥
Technical Highlights:
✅ Breakout Attempt: Pushed above short-term horizontal resistance (active since early Sept) but couldn't secure the close.
✅ Volume: Rising volume trend shows strong buyer interest.
⚠️ Candlestick Alert: Formed an inverted hammer at the top—a potential bearish reversal sign!
✅ Momentum: Short-term EMAs in positive crossover (Daily/Weekly/Monthly). MA
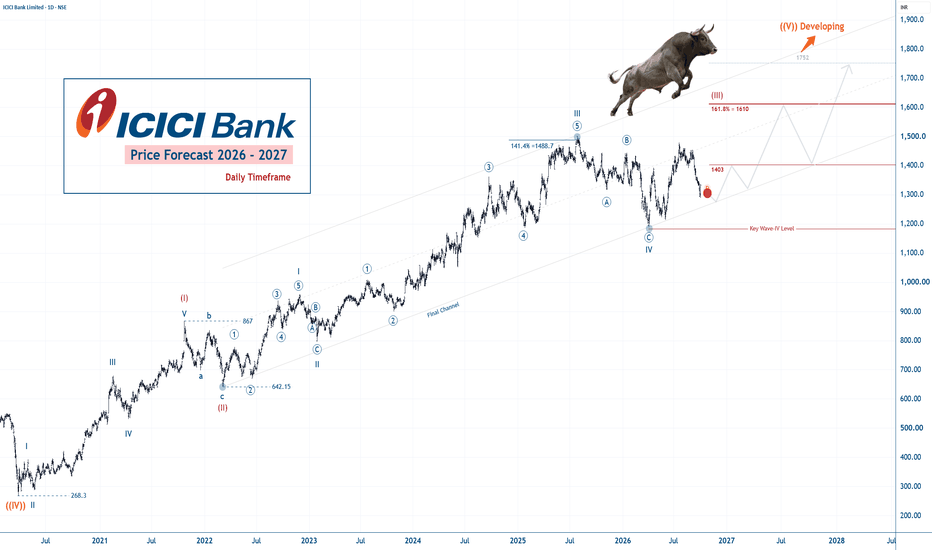
ICICI Bank Price Forecast 2026 - 2027🏦 ICICI Bank: Wave ((V)) Developing - 1610 or 1752+ Next?
According to Elliott Wave Theory, the previous Wave ((IV)) appears to have completed around 268.30 in March 2020. From that low, NSE:ICICIBANK began a major advance that can be interpreted as the developing Wave ((V)).
The first leg of this larger advance, Wave (I) , developed from March 2020 to October 2021, reaching around 867 . A corrective Wave (II) then followed, ending around June 2022 near 642.15 .
⭕ Wave (III) — De
BHARATCOAL Long Setup at Major Rectangle SupportBharat Coking Coal Limited is currently exhibiting a well-defined rectangular consolidation pattern on the weekly timeframe.
Technical Rationale:
On this weekly chart, the price has been continuously oscillating within a Darvas box, bounded by a strong support base near the 31.50–32.00 level and a resistance ceiling around 44.00–45.00.
After a steady decline from the upper resistance, the asset is currently testing the bottom of the box.
The most recent weekly candle is showing signs of a bu