Gold Futures (GC): Daily Structure Suggests a Bottom Is In
Gold futures have spent the last several weeks carving out what looks like a genuine change of character on the daily chart, and price action over the last few sessions has confirmed it. Here's the structural read and what I'm watching next.
Market structure shift
Since the swing high in the 5,300–5,600 area earlier this year, GC has been in a clean sequence of lower highs and lower lows, with the decline accelerating into the 4,000–4,100 zone in July. That's where the character started to ch
Indianhumepipetrendanalysis
Identify Order Blocks Using Market Structure & Fixed Range VolumThis educational chart explains a simple Smart Money Concepts (SMC) strategy for identifying high-probability Order Blocks by combining Market Structure with the Fixed Range Volume Profile.
What you'll learn:
How to identify valid Order Blocks
Using Market Structure (BOS & CHoCH) correctly
Combining Fixed Range Volume Profile with SMC
Internal vs. External Structure trades
real chart examples for better understanding
Key Notes:
Gold remains bearish on the 1-hour timeframe until the CHoCH is
Natural Gas Futures – Swing Buying SetupNatural Gas Futures – Swing Buying Setup
Instrument: **Natural Gas Futures (MCX)
Timeframe: Daily
1️⃣ Strong Support Zone Holding
Price is holding above a major demand zone around 230–250.
Reasons this zone is important:
Previous multi-month base
Strong historical buying interest
Multiple price rejections
This suggests institutional accumulation near support.
2️⃣ Bullish RSI Divergence
A bullish divergence (DIV) is visible on Relative Strength Index.
Structure:
Price made lower lows
Good Support Spotted In Lux Industries LtdLux Industries Ltd is trading near Long-Term Support and Law Of Polarity (LOP). It can undergo any pattern in coming time say triangle, double bottom, wedge or v shape recovery.
Highest volume activity near this zone, RSI is around a small support.
One can have a first mover advantage investing around current level. Stock might see max downside till 1150 in case of market volatility or on some bad news.
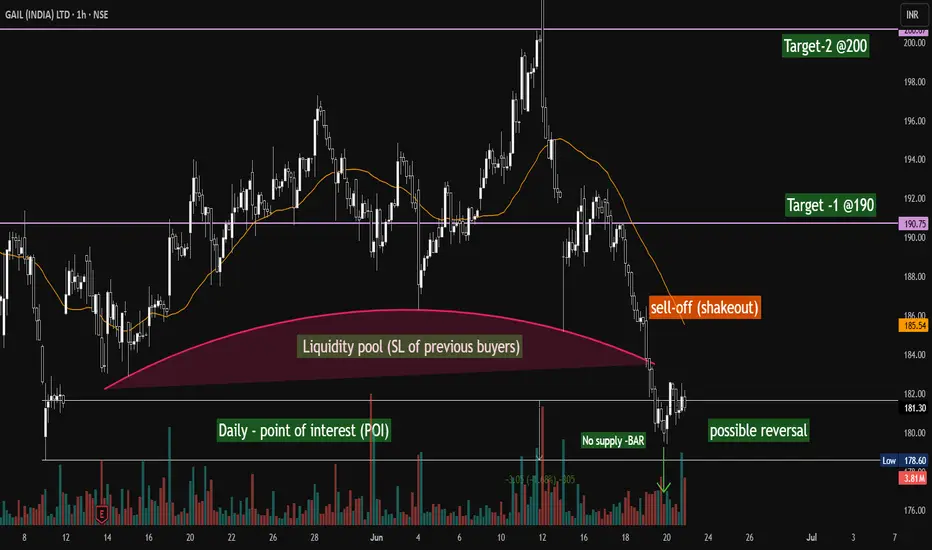
GAIL (INDIA) - Possible Reversal on the corner...GAIL (India) Ltd – 1H Chart Analysis (NSE) | June 21, 2025
Spotted a potential setup with key institutional footprints on the 1H chart:
🟥 Liquidity Pool Grab: Price dipped into the liquidity zone (SL sweep of previous buyers), potentially clearing weak hands.
📉 Shakeout Sell-Off: A sharp decline hints at a textbook shakeout—classic Wyckoff-style distribution at work.
✅ Daily POI + No Supply Bar: Price tapped into a higher timeframe (Daily) Point of Interest, accompanied by a low-volume no-su
Indian Hume Pipe cmp 434.65 by Daily Chart viewIndian Hume Pipe cmp 434.65 by Daily Chart view
- Support Zone 370 to 395 Price Band
- Resistance Zone 345 to 370 Price Band
- Falling Resistance Trendlines are well broken out
- Stock Price attempting Breakout from Resistance Zone
- Volumes seen increasing steadily tad close to avg traded quantity
- Bullish Rounding Bottom including Cup & Handle at Resistance Zone neckline
- Sloping Bullish Head & Shoulders too formed, maybe taken under consideration
- Resistance Zone breakout probable by hea
KOPRAN 12 MONTH LONG CONSOLIDATION BREAKOUT Kopran Ltd. is an interesting consolidation breakout stock
1. 12 month's Consolidation breakout in the chart
2. RSI on all time frames above 60
3. Price Breakout with huge Volume candles
4. ABCD pattern on weekly chart
5. Major supports with cluster of moving averages in zone of 247 - 273 which can act as multiple support area.
Lets See How it Evolves.
Disclaimer: NOT A BUY / SELL RECOMMENDATION I am not an expert I just share interesting charts here for educational purpose and not to
ALEMBICLTDALEMBICLTD:- keep on eye at crucial level. short term target 111.45
Hello traders,
As always, simple and neat charts so everyone can understand and not make it too complicated.
rest details mentioned in the chart.
will be posting more such ideas like this. Until that, like share and follow :)
check my other ideas to get to know about all the successful trades based on price action.
Thanks,
Ajay.
keep learning and keep earning.
TRIVENI Giving Move !Stock is in uptrend.
Giving a all time high breakout with good volumes.
Formed a Cup and Handle Pattern and giving breakout.
Go Long if Stock Sustain above 212 or can go long after retest from the same level.
Trail your SL for good gains.
Also Please do your own analysis before buying.