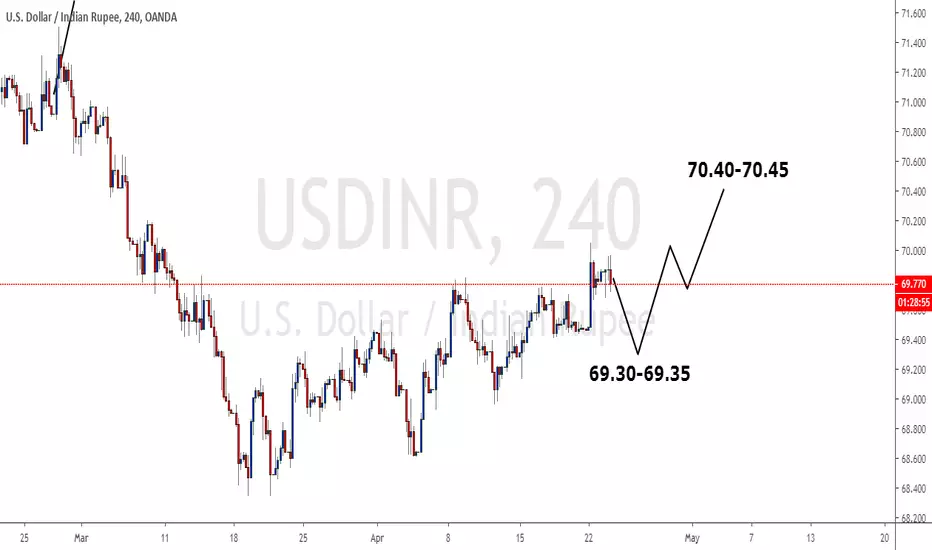
USDINR - Short term directionThe currency pair is moving in corrective structures and is expected to extend the fall towards 69.30-69.35 range and then moving higher towards 70.40-70.45 in next one to two weeks.Uby aditya.thukral423Updated 0
USDINR Possible Downward in Short TermPossible target for the short is 67 area and If breaks above 72, this plan will fail.UShortby WahyedUpdated 0
USDIN Bulls are ready to take overUSDINR is riding slowing on a bull trend with an strong support at ₹69.13, 69.001 and 68.47 Whenever it touches any of the support don't panic and wait for it to give a closing price of the day. If it below then it is still in bear trend. Otherwise, taking the (SL) of ₹69.06 with the target of 69.70 and 70.20 in coming days. Longby UnknownUnicorn3503085Updated 41
27 March 2019 Long EUR/USD 27 March 2019 Long EUR/USD @1.12498 StopLoss 20 Pips @1.12298 TakeProfit 20 Pips @1.12698Longby twentypips_comUpdated 0
USD INR - Short - Chart PatternUSD INR looks to go down till 69.115. Shortby SchoolofMarketsUpdated 0
PAIN FOR INR AHEADAfter breaching the all time high on AUG 14, Analysts would be looking at USD/INR's market action in the coming weeks, If the move sustains, the new 'normal' would be between 71-75 for USD/INR as per monthly charts. ULongby Vashisht_CFTeUpdated 22
USD/INR Long Opportunity From 72.8000 USD/INR long From 72.8000 Target Point 74.3000 Stop Loss 7250 Stay Tuned.......!! Learn Here , Earn EverWhereLongby KHAN786000015
longone day candle should close above the prescribed buy level refer chart for details it is so bullish will reach that level ULongby karthik98ks0
USD/GBP in bullish trend.USD seems to have bottomed out with clear recovery and short term bullishness. Longby ProfitableLoserUpdated 1
Negative Divergence in USDINRMomentum indicators are showing negative divergence in INR. targetting 66.50UShortby rohitkaranUpdated 1
Ascending Triangle on USDINRAscending Triangle pattern formation on USDINR and the price near to the DEMA 200. Trade: Buy above - 65.025 Target 1 - 65.525 Target 2 - 66.135 Stop Loss - 64.295ULongby raj3eliteUpdated 7
EURINR Elliottwave: Looking for break of monthly trendlineTalking Points: Technical Strategy: Bearish Elliottwave Count: Either wave (C) continuation or B wave of (B). HTG Note: Larger outlook on weekly chart is showing weakness on long and short term. EURO vs Indian Rupee price is testing weekly trend line. Last time this line was tested on September, 2015 and post that we seen nice pullback towards 77.80 levels. We in HTG consider that was correction and marking as a wave (B). From 77.80, we were seen bear continuation and currently price iShortby Hittesh1
USDINR Short - Move out of BalanceBalance B/O , SL 66.20 (if it enters upper balance), target 1 isPOC of lower balance which is around 65.25 and target 2 is lower bracket of balance around 64.3Shortby thetraderrr11
Market MovementsToday the market is almost at the same point it was a year ago. So during the year the market at seen quite a bit of a roller coaster. This year the Indian indices have been strongly affected by the USD strength. This chart is a correlation between the two variables, the USD and INR. The chart on the top shows a strong negative correlation between the two variables, meaning when the USD becomes stronger the sensex becomes weaker. The fall of the sensex in Aug 2015, in Feb 2016 and again in Nov by NarUpdated 1