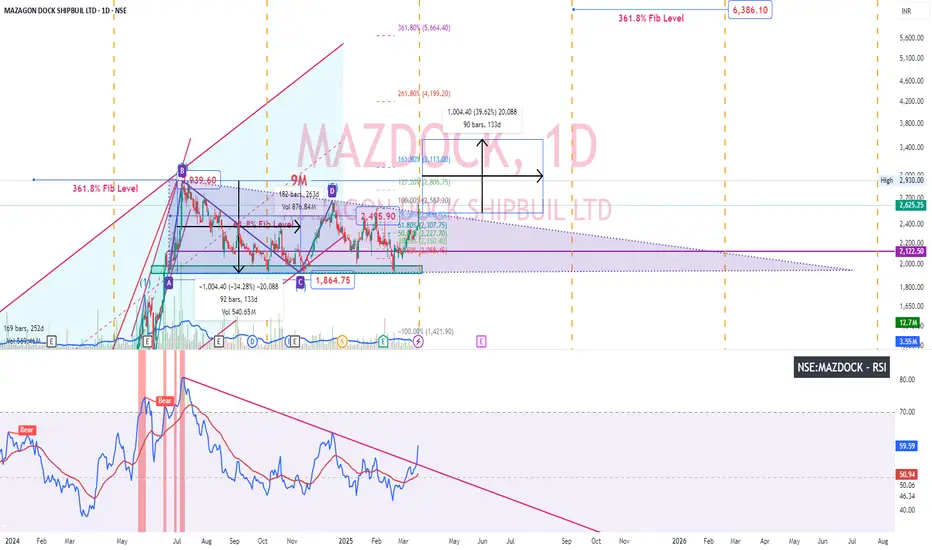
Mazdock - Price, RSI breakout - D timeframeMazdock after good Q3 descending triangle breakout. Usually descending triangle is bearish pattern. Let's see if the target 3539.40 gets reached (height of the triangle) Longby naraykln1
Mazagon Dock cmp 2445 by Weekly Chart viewMazagon Dock cmp 2445 by Weekly Chart view - Support Zone at 1925 to 2000 Price Band - Stock trying to sustain above the support zone for fresh upside - Stock also attempting to cross over the falling resistance trendline - Stock made back to back Bullish Rounding Bottoms or Cup & Handle, as one may interpret the chart viewby PIYUSHCHAVDA3
Mazagon Dock Shipbuilders Ltd. - Breakout OpportunityDate : 5-Dec-2024 LTP : Rs. 4,880.70 Targets: (T1) Rs. 5,545 --> (T2) Rs. 5,860 --> (T3) Rs. 7,100 SL : Rs. 4,245 Technical View: • NSE:MAZDOCK is in primary uptrend and was recently going through it's secondary downtrend within primary uptrend. • After touching the high of 5,860 on 5-Jul-2024, it has retraced 34% to 3,851.20 level. • NSE:MAZDOCK has breakout from it's secondary downtrend with higher than average volume on 4-Dec-2024. This breakout is also supported by increased volumLongby vikrant_252Updated 213
Mazagon Dock cmp 4594.15 by Daily Chart view*Mazagon Dock cmp 4594.15 by Daily Chart view* - Support Zone 3840 to 3920 Price Band - Resistance Zone 4820 to 4960 Price Band - Price Breakout above Falling Resistance Trendline - Weekly Support at 4325 > 3920 > 3550 with Resistance at 4960 > 5265 > 5550 > ATH 5860 - *Decent probability maybe anticipated to breach across the Resistance Zone by the way the Volumes are building up over the past few days*Longby PIYUSHCHAVDA694
 LongLongLong
 Long