Ask Automotive : Breakout Stock#Askautoltd #vcp #Flagpattern #chartpattern #breakouttrading
ASK AUTOMOTIVE LTD : Swing Trade
>> Basing Patern at 10EMA (VCP Forming)
>> Flag Breakout
>>Trending Setup
>> Good Strength & Volume Rising
>> Upside Potential upto 16%
Swing Traders can lock Profit at 10% and Keep trailing
Follow us, Boost the Trading Ideas if u Like our Analysis
Disclaimer : Charts Shared are for Learning Purpose, not a Trade Recommendation
Momentumstocks

Rane Engine : Momentum Stock#Raneengine #threewhitesoldiers #fairvaluegap #momentumpick #trendingstock #Swingtrade
Rane Engine : Momentum Trade
>>TWS & FVG Visible
>> Bounce back form FVG Visible
>> Trending Setup
>> Good Strength & Volume Expansion soon
>> Potential of more than 20% upside
Swing Traders can lock profit at 10% and keep Trailing.
If u Like the Analysis, Boost it and Follow us for such Trade Ideas
Disclaimer : Stock Charts shared are for Learning Purpose and not a Buy or Sell Recommendations.

HBLPOWER - Chart looks strong for swing trading#HBLPOWER
~Bouncing back from 10 Day EMA
~Last 3 day volume is above 10 day average volume line
~Chart shows higher volume when price moves
higher, showing strenght in stock
~Rising moving average line

Understanding the Sun Tv Stock Price Movement(1) The price is generally trending upwards.
(2) Following the breakout of the Rounding Bottom pattern, the price is now consolidating above the breakout point.
(3) There has been a significant increase in volume, suggesting strong buyer interest.

Volume Surge in NCC: What it Signals for Future Growth?(1) The price had previously formed an ascending triangle pattern and broke out of the pattern with a large volume.
(2) After that, the price continued to move upwards by creating higher highs and lows.
(3) Now, the price is trading close to its all-time high with a decent volume and is expected to move even higher

Astral rising: How the Stock Price Defies Gravity in the Market(1) The price broke through resistance and surged after a prolonged consolidation
(2) It is now maintaining upward momentum with higher highs and higher lows.
(3) Following a breakout, the price is near its record high and expected to keep rising.

WIPRO, Technical Outlook (Keep this stock in the watch list)Today the price has closed on the resistance level with a RSI of above 60. All this indicates the price is in good momentum.
The breakout of 492 could open the higher levels of 545.
Disclaimer: This is my pre market analysis and my trading journal. Not a suggestion to buy or sell.

PNB, Intraday View for 19-JuneThere is no change in the structure and the price has failed to close above 130.
But the price is still in the positive zone.
For tomorrow the intraday range is 130 to 136 and 126 to 122.
Disclaimer: This is my pre market analysis and my trading journal. Not a suggestion to buy or sell.

ICICIGI Strong BuyICICIGI is a strong contender.
after making Higher high, Stock is consolidating. supported by Divergence at this levels shows Signs of Trend Continuation.
Kindly maintain Stoploss and Execute your Trades.

#Sail Accumulate in PartsSlow move by SAIL. #Sail lacking #Momentum but the #Stock is in Uptrend as the Stock Made HigherHigh in Monthly Charts.

#Motherson #Investment PickWait for levels to reach and Price-action shd give confirmation.
Always wait for the right levels to make your investment. Stocks moves irrespective of market sentiment.

StrongBuy SailSail made a strong #Breakout in weekly timeframe and made confirmation with the follow up candle.
Can expect quick move in shorter time. Look for Proper Entry Point. Maintain proper SL.
Will get Good Rewards.

HDFCLIFEStock made a higher high and at higher low.
currently in a consolidation phase. buy in parts in current levels and also at levels below it.
Buy in parts for better Money management

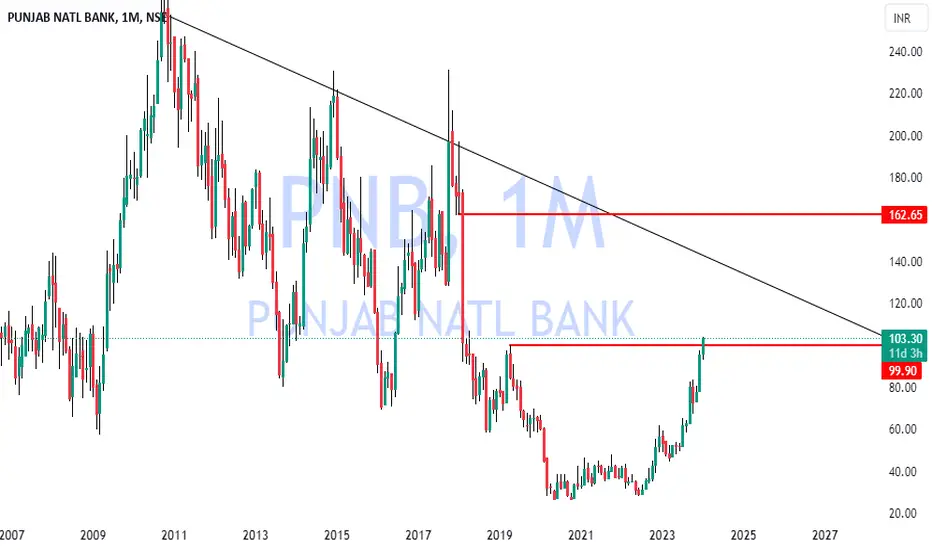
PNB At Major Make or Breakout levels.PNB at Major levels, with momentum and with little support from Sectors.
Conservative Traders can enter after Breakout and Retest.
Anyway stock is towards Monthly Supply which is on TOP.
Have your own Analysis too.
Shipping CP IndiaShipping CP India is making a huge Breakout in Monthly Timeframe, which is alomst 18 Yrs Breakout.
Weekly Timeframe confirms with a follow up candle.
Its a Buy on Dips Stock.
Buy at proper Demandzone for proper Riskreward. Better buy at retracement.

PricaAction in NitinSpinning1) Stock made Higher High,
2) Retracement is over
3) Priceaction is done
4) Entry above the Pin Bar
50 Stop loss and target in charts

BUY PELLook into the chart. Stock moving towards proper buying levels after making a HIGH , so the trend is up.
Good to hold for Swing Trade / Short term trade.

#tatachemicals Stocks in watchbuy in Small qty., can accumulate later when trend reversal is confirmed. Incase if SL is taken, look for next Strong level at bottom , buy and hold for #Short to #Longterm

#Seshapaper #PapersectorStock broke previous High and consistently making Higher highs.
Now stock is on retracement, Best to Buy on dips with proper SL.
Wait for Priceaction for Proper Entry point.

#Buy NaukriStock Made a Higher High. So the trend is Intact.
Stock is now at retracement point and Price Action is Confirmed. Best buy for a minimum tgt of 1:2
Maintain SL. Analyse your own trades.

#LIBERTYSHOEStock made a Strong Higher high, retraced back for accumulation.
Price falling to Proper Buy Zone, wait for Levels to Trigger / Priceaction.
Maintain Proper SL.

Lovable Lingerie : Bullish Setup (Swing Trade / Short term)#lovable #momentumtrading #momentumstock #swingtrading #swingstock
Lovable : Beautiful Bullish structure
>> Breakout Candidate
>> Good strength in stock
>> Decent Volume
Swing traders can book profit partially or full at 10% or keep trailling, Short term traders can Keep trailling
Please Like or comment if u r Liking the analysis & Learning from it. Keep showing ur Love
Disclaimer : This is not a Trade Recommendations & Charts/ stocks Mentioned are for Learning/Educational Purpose. Do your Own Analysis before Taking positions.

PSU BANKING CHAMPION - BANK OF BARODABOB (BANKBARODA) has hit new 52 week high and hardly 15% away from it's all time high zones of approx 228.
The scrip has taken it's own sweet time and the way it is moving, it reflects a poised action. Expecting this to breakpast its ALL TIME HIGHS and head for 350++ levels.
cmp 199
