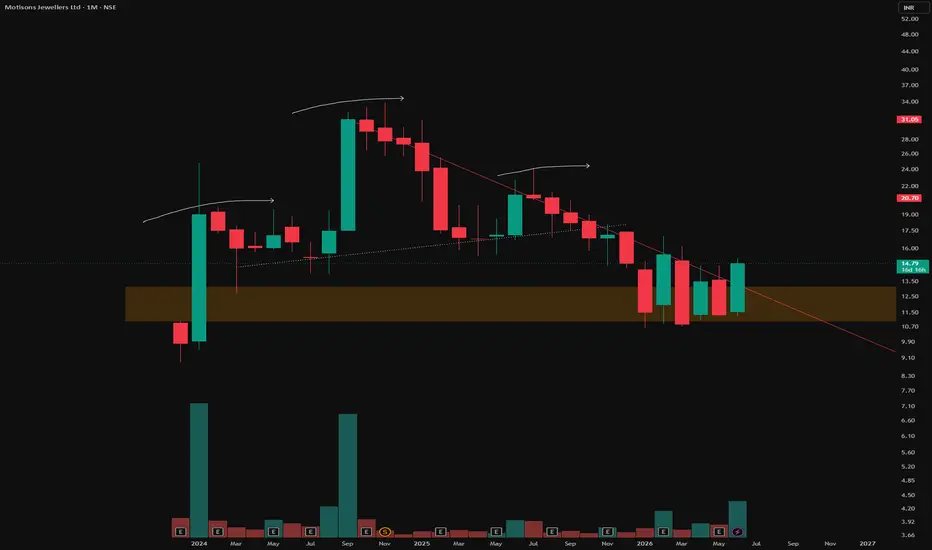
Motisons Jewellers cmp 18.35 Weekly Chart since listedMotisons Jewellers cmp 18.35 Weekly Chart since listed
- Support Zone 12 to 17 Price Band
- Resistance Zone 19.50 to 24 Price Band
- Rounding Bottoms within the Support Zone
- Heavy Volumes seen spiking since June 2026
- 1st Resistance Trendline Breakout well sustained
- 2nd Resistance Trendline Breakout been attempted
- Breakout above 2nd Resistance Trendline for fresh uptrend
MOTISONS
What Retail Traders Miss Inside a Sideways MarketA sideways market may look like nothing more than price moving between support and resistance.
But look deeper, and there can be an entire story developing inside that range.
On this monthly chart, price is broadly contained between a Supply Zone and a Demand Zone. Within that larger structure, however, several layers of price action begin to appear.
A Head & Shoulders formation develops near the upper portion of the range, with the head forming around supply. The rising red trendline acts as
Global and Local Market strucutre shifts : Talking to chartsThis post is educational and observational in nature based on historical price action. It is not a forecast or a trading recommendation.
Fair Value Gap (Green Zone)
An imbalance area on the chart, where price moved rapidly and left behind a gap between candles that wasn't efficiently traded through. These zones are often revisited later as price tends to seek out and fill areas of imbalance.
Local Market Structure Shift (Red Line)
A shorter term change in structure, reflecting a shift in
Head & Shoulders Meets a Historic Fair Value GapThe monthly chart presents a textbook sequence of price action events
Beginning with the formation of a Fair Value Gap (FVG) — an imbalance zone (highlighted in orange) created by the most significant single candle in the stock's entire monthly history.
Such gaps represent areas of price inefficiency where the market moved so aggressively in one direction that little to no two-sided trading occurred.
Following this, the structure developed a Higher High, Higher Low sequence — the defini
MOTISONS, positive outlook in coming daysNSE:MOTISONS
Again coming up with trade idea. tight consolidation in range of 3-4% within last 5-6 days. Price is taking support on short term EMA. Looks like weak hands are exiting. Breaking above the pivot line (22.08) could lead to significant push when crossing with good volume. Good volume is observed today.
SL is somewhere around 5-6% (Refer the long position drawn over the chart).
One can invest 10% portfolio size as per following calculations
Position sizing and managing risk is the k
MOTISONS : Breakout Stock#MOTISONS #swingtrade #vcppattern #breakout #trendingstock
MOTISONS : Swing Trade
>> Trending Stock
>> Breakout Candidate
>> VCP pattern
>> Good strength & Volume Buildup
>> Good Upside Potential
Swing Traders can lock profit at 10% and keep Trailing
Please Boost, comment and follow us for more Learnings.
Disc : Charts shared are for learning purpose only, not a Trade recommendation. Do your own research and consult your financial advisor before taking any position.
MotiSons Jewellers - A Bubble BurstMotiSons Jewellers has a bad jockey i.e. the promoters have a history of bad reputation & finally the bubble has burst now a days pump & dump & stock split is common modus of operandi to trap innocent investors.
Wave analysis & Volume profile suggest operator has dumped all stock in range of 27-31 now retailers will keep averaging till 12-9 range.
MOTISONS - Symmetrical triangle - Breakout - DailyMOTISONS - Symmetrical triangle - Breakout - Daily
Name - MOTISONS
Pattern - Symmetrical triangle Breakout
Timeframe - Daily
Volume - Very good volume
Cmp - 219
Target - 283
SL - 195 and 167
Always welcome for any comments with your feedback or give it a like if you find it useful.