lodha realty clear support! Lodha Realty maintains a clear support level showing resilience in the current market environment. The stock has been trading consistently around this support, indicating strong investor confidence at these levels. If it continues to hold, we might expect a potential rebound or consolidation in the near term, making it a key area to watch for traders and investors looking for entry points.
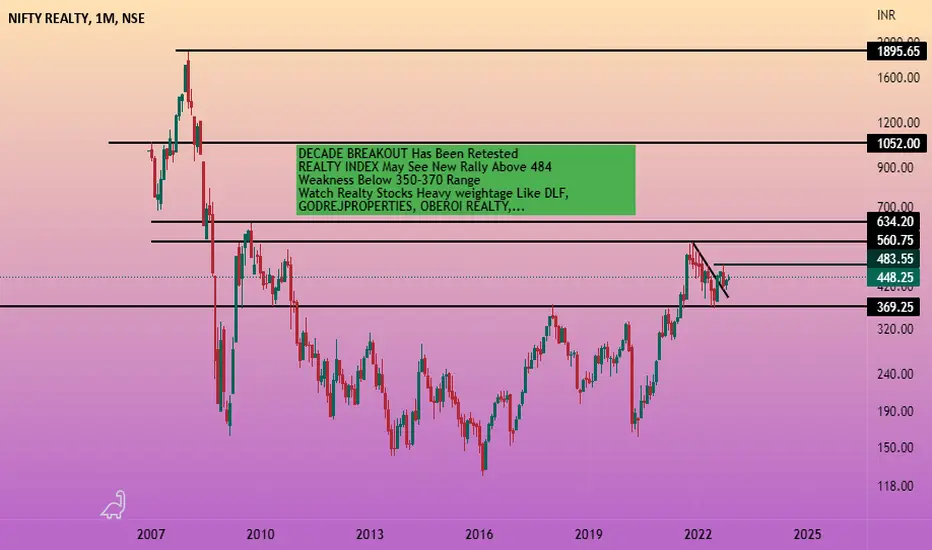
Niftyrealty

Sobha LtdAll important points are marked.
𝐃𝐢𝐬𝐜𝐥𝐚𝐢𝐦𝐞𝐫: 𝐈𝐧𝐯𝐞𝐬𝐭𝐦𝐞𝐧𝐭 𝐢𝐧 𝐬𝐞𝐜𝐮𝐫𝐢𝐭𝐢𝐞𝐬 𝐦𝐚𝐫𝐤𝐞𝐭 𝐚𝐫𝐞 𝐬𝐮𝐛𝐣𝐞𝐜𝐭 𝐭𝐨 𝐦𝐚𝐫𝐤𝐞𝐭 𝐫𝐢𝐬𝐤𝐬, 𝐫𝐞𝐚𝐝 𝐚𝐥𝐥 𝐭𝐡𝐞 𝐫𝐞𝐥𝐚𝐭𝐞𝐝 𝐝𝐨𝐜𝐮𝐦𝐞𝐧𝐭𝐬 𝐜𝐚𝐫𝐞𝐟𝐮𝐥𝐥𝐲 𝐛𝐞𝐟𝐨𝐫𝐞 𝐢𝐧𝐯𝐞𝐬𝐭𝐢𝐧𝐠. 𝐒𝐭𝐨𝐜𝐤𝐬 𝐬𝐮𝐠𝐠𝐞𝐬𝐭𝐞𝐝 𝐢𝐧 𝐭𝐡𝐢𝐬 𝐠𝐫𝐨𝐮𝐩 𝐚𝐫𝐞 𝐟𝐨𝐫 𝐞𝐝𝐮𝐜𝐚𝐭𝐢𝐨𝐧 𝐩𝐮𝐫𝐩𝐨𝐬𝐞. 𝐖𝐞 𝐝𝐨𝐧𝐭 𝐦𝐚𝐤𝐞 𝐚𝐧𝐲 𝐩𝐫𝐨𝐟𝐢𝐭𝐬 𝐟𝐫𝐨𝐦 𝐭𝐡𝐢𝐬 𝐫𝐞𝐜𝐨𝐦𝐦𝐞𝐧𝐝𝐚𝐭𝐢𝐨𝐧𝐬 𝐞𝐯𝐞𝐫𝐲𝐭𝐡𝐢𝐧𝐠 𝐬𝐡𝐚𝐫𝐞𝐝 𝐡𝐞𝐫𝐞 𝐚𝐫𝐞 𝐜𝐨𝐦𝐩𝐥𝐞𝐭𝐞𝐥𝐲 𝐨𝐟 𝐟𝐫𝐞𝐞 𝐨𝐟 𝐜𝐨𝐬𝐭.

Macrotech developers Ltd (LODHA)All important points are marked.
𝐃𝐢𝐬𝐜𝐥𝐚𝐢𝐦𝐞𝐫: 𝐈𝐧𝐯𝐞𝐬𝐭𝐦𝐞𝐧𝐭 𝐢𝐧 𝐬𝐞𝐜𝐮𝐫𝐢𝐭𝐢𝐞𝐬 𝐦𝐚𝐫𝐤𝐞𝐭 𝐚𝐫𝐞 𝐬𝐮𝐛𝐣𝐞𝐜𝐭 𝐭𝐨 𝐦𝐚𝐫𝐤𝐞𝐭 𝐫𝐢𝐬𝐤𝐬, 𝐫𝐞𝐚𝐝 𝐚𝐥𝐥 𝐭𝐡𝐞 𝐫𝐞𝐥𝐚𝐭𝐞𝐝 𝐝𝐨𝐜𝐮𝐦𝐞𝐧𝐭𝐬 𝐜𝐚𝐫𝐞𝐟𝐮𝐥𝐥𝐲 𝐛𝐞𝐟𝐨𝐫𝐞 𝐢𝐧𝐯𝐞𝐬𝐭𝐢𝐧𝐠. 𝐒𝐭𝐨𝐜𝐤𝐬 𝐬𝐮𝐠𝐠𝐞𝐬𝐭𝐞𝐝 𝐢𝐧 𝐭𝐡𝐢𝐬 𝐠𝐫𝐨𝐮𝐩 𝐚𝐫𝐞 𝐟𝐨𝐫 𝐞𝐝𝐮𝐜𝐚𝐭𝐢𝐨𝐧 𝐩𝐮𝐫𝐩𝐨𝐬𝐞. 𝐖𝐞 𝐝𝐨𝐧𝐭 𝐦𝐚𝐤𝐞 𝐚𝐧𝐲 𝐩𝐫𝐨𝐟𝐢𝐭𝐬 𝐟𝐫𝐨𝐦 𝐭𝐡𝐢𝐬 𝐫𝐞𝐜𝐨𝐦𝐦𝐞𝐧𝐝𝐚𝐭𝐢𝐨𝐧𝐬 𝐞𝐯𝐞𝐫𝐲𝐭𝐡𝐢𝐧𝐠 𝐬𝐡𝐚𝐫𝐞𝐝 𝐡𝐞𝐫𝐞 𝐚𝐫𝐞 𝐜𝐨𝐦𝐩𝐥𝐞𝐭𝐞𝐥𝐲 𝐨𝐟 𝐟𝐫𝐞𝐞 𝐨𝐟 𝐜𝐨𝐬𝐭.

The Banking-FMCG-Realty Trifecta Turbocharges Market Growth.Nifty Bank
The Bank Nifty is on a strong upward trend, consistently making higher highs and lows.
It has recently broken through its previous all-time high while moving within an ascending parallel channel, indicating potential for further gains.
Nifty FMCG
The FMCG sector is a major player in the market, and with a recent breakout, the index has reached its all-time high.
The price action indicates bullish momentum, suggesting it could continue to rise.
Nifty Realty
While the overall trend is positive, the realty sector has struggled to make a significant impact in recent months.
However, a bullish Pole & Flag pattern has appeared on the chart, signalled a possible continuation of the upward trend.
A recent breakout shows the index is active again.

Nifty Realty Index - Difficult times ahead????Nifty Realty Index have broken rising trendline of 5 months. I have checked a few realty stocks also. They too don't look promising either. My tgt for the index comes at 935/25. If these levels are breached with conviction than more pain ahead with target between 865/50.
The realty market, in major cities of India, look oversupplied esp the luxury market. I feel there shall be some correction in these markets as well. The prices in metro cities also seem to be overpriced (a personal view). Also, with deposit in bank not looking promising, I feel RBI will not cut rates, as it will be contradict their concern.
On the contrary, if the index goes above 1115, the view is negated. CMP 1018
Hope for the best. Have a great trading.

ACTION CONSTRUCTION - Swing Trade Analysis - 19th June #stocksACTION CONSTRUCTION (1D TF) - Swing Trade Analysis given on 19th June, 2024
Pattern: FALLING WEDGE BREAKOUT
- Resistance Breakout - Done ✓
- Volume Buildup at Resistance - Done ✓
- Demand Zone Retest & Consolidation - Done ✓
* Disclaimer

KNR CONSTRUCTIONS - MID TERM Analysis - 2nd June #stocksKNR CONSTRUCTIONS (1M TF) - MID TERM Trade Analysis given on 2nd June, 2024
Pattern: SYMMETRICAL TRIANGLE BREAKOUT
- Monthly Resistance Breakout - Done ✓
- Monthly Volume Buildup - Done ✓
- Demand Zone Retest & Consolidation - In Progress
Please Note:
- Entry has to be at the Demand Zone at around 300 (which is also our previous target level which we achieved)
- Next support is at 285
- Ensure to position size correctly
* Disclaimer

KNR constructions longLong KNR constructions
CMP 265
Triangle breakout with good volume.
It can be fake breakout
So,
Buy Above 277
Stoploss 226
Swing Trade
Target 1 299
Target 2 310
Long Term
Target 1 317
Target 2 339

DLF Is showing continues correction from upper levels Stocks to Keep in Radar for Next Week
⏩ SBIN
⏩ NMDC
⏩ BHEL
⏩ DLF
DLF is forming lower lows from past few weeks
now it has come around prev support level
Wait for price to form price action pattern
if decisively sustains outside the range of 780 to 850,
directional movement could be possible
However in case of Bearish pattern at higher level, it may come back to prev week's range
*Election Results can create Volatility in the Maket
Keep Tracking Charts
*For Educational Purpose
Learn & Practice Price Action setups

DLF for 09-04-2024Hello Friends
I hope all of you are doing well!!
DLF share price learning and my view for the 09th day of April, 2024.
You can share your views on the DLF share chart.
Keep Learning with NG!!
Thank You
Nitin Grover

DLF for 19.03.2024Dear Friends
Ram Ram Ji
DLF view for 19.03.2024.....
I am just sharing my view with you friends, you can please add your view no this.
Regards

DLF is in rest mode to take a big move.....DLF a champion in the real estate sector is resting to take the big move on either side......
Lets catch the move...... and learn that
Keep Learing with NG!!

if Nifty Realty reverse from 735.10 then what about DLF?Hello!!
If Nifty Realty reverse from 735.10 for let say 3 points...
What we can expect in the DLF?
can it be a good move?
Keep Learning with NG!!
:)

Nifty Realty Long term trend analysisThe nifty reality is the long term consoldiation phase this time the index is the brackout & than the pull back, 510 is support level and above 600 is bullish level

INDIABULLS REAL EST forming a cup and handleINDIABULLS REAL EST is giving a breakout by forming a cup and handle pattern and also breaking a trendline that can be bought above 89.

Is NIFTY REALTY ready for another bull run??Trade Or Invest Wisely.
We Can Just Predict.
Disclaimer: I am not a SEBI registered advisor, so before entering on my view please ask your SEBI registered advisor. Profit is your and loss is your.
Please like and share if you agree with the idea.
PERSTIGE - BULLISH ENGULFING 📊 Script: PRESTIGE (PRESTIGE ESTATES PROJECTS LIMITED)
📊 Nifty50 Stock: NO
📊 Sectoral Index: NIFTY REALTY / NIFTY MIDCAP 100
📊 Sector: Realty
📊 Industry: Residential Commercial Projects
Key highlights: 💡⚡
📈 Script is trading at middle band of BB and taking support of middle band which is SMA20.
📈 Already crossover in MACD.
📈 Already Crossover in Double Moving Averages.
📈 Double candlestick pattern BULLISH ENGULFING seen which indicate Bullishness in stock.
📈 Right now RSI is around 56.
📈 One can go for Swing Trade.
⏱️ C.M.P 📑💰- 455
🟢 Target 🎯🏆 - 517
⚠️ Stoploss ☠️🚫 - 428
⚠️ Important: Always maintain your Risk & Reward Ratio.
✅Like and follow to never miss a new idea!✅
Disclaimer: I am not SEBI Registered Advisor. My posts are purely for training and educational purposes.
Eat🍜 Sleep😴 TradingView📈 Repeat🔁
Happy learning with trading. Cheers!🥂

DLF - BreakoutDLF has given a broadening wedge trendline resistance breakout , also is making an inverted head & Shoulder pattern on daily time frame. Keep this in watchlist for next few weeks and it can give good returns in coming days

Breakout in Nifty Reality This is weekly timeframe.
Nifty Reality had took support at 0.50 fibo level.
There is high probability that it may test 52 week high in next coming months or may be it can take more than a year.
From current level its more than 28% up.
I will be now closely watching the reality sector's largecap stocks for positional trading opportunities.
We have here back to back two bullish hammers, one almost like a bullish belt-hold, one belt-hold
and next on thick bullish candle with breakout forming perfect three white soldiers here.
This post is for infomation purpose only.

IEX MIGHT SEE A SELL OFF IN UPCOMING DAYSIEX is looking good to short
Technical reasons for the trade
1. The stock is resisting and taking support from the trendlines which are in color
2. The stock took support from a red trendline 2 times now it is trading near that trend line so it might break it and also it is trading near its 200ema so this might also be broken.
3. The stock formed a bearish flag pattern and recently it had given a breakout.
Fundamental reasons
1. Due to the US market crash we could expect a small correction in the upcoming days.
2. Due to LIC IPO the market will see a sell-off.
3. The recent results of the stock are also bad so there is a bad sentiment in the market.
So, we must short it when it breaks it 200ema and the pattern height could be taken as a target.

DLF INDIA DAILY CHART AS ON 10.01.2022 TARGET ACHIEVEDPosted on 06.01.2022 DLF INDIA Stock above 404.50 for a target 408.50 and today the stock made a high 411.75 and closed at 407.95

CNXREALTY/NIFTYIt has crossed one resistance and consolidating before breaking another. It seems now its times for laggards like realty. Some good rally can be seen in coming days

CNXREALTYClose above trendline will make real estate sector more bullish and long position can be taken in good real estate stocks
