H1 Major Demand Recovery Setup
XAUUSD is trading around 4,125 after extending the bearish leg into the 4,112–4,128 Demand / Reaction Zone. H1 remains under pressure beneath the descending trendline, but price is approaching deeper structural demand where a liquidity sweep could create a cleaner recovery setup.
Gold fell to a two-month low on Wednesday, with spot gold around $4,114, as a stronger U.S. dollar and elevated Treasury yields continued to pressure non-yielding bullion. Reuters
The latest FOMC minutes showed policym
NYKAA
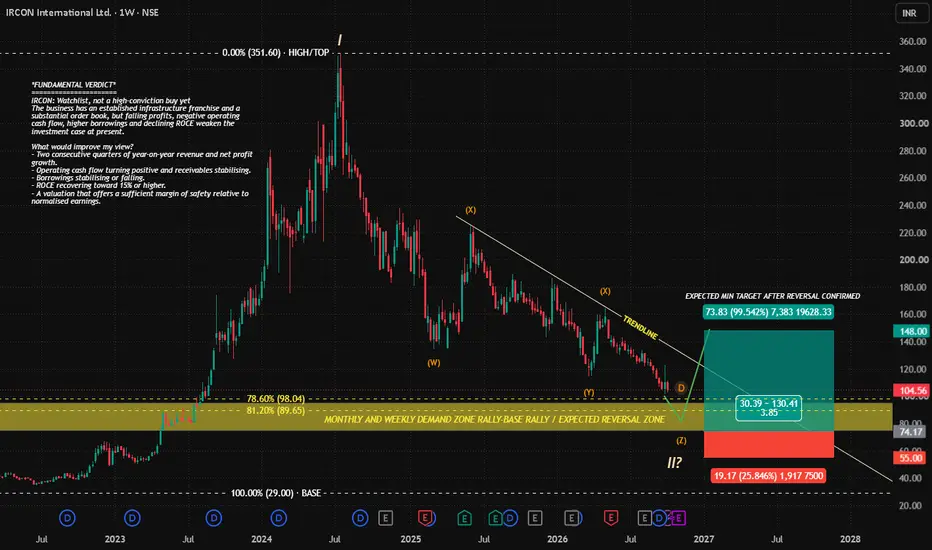
IRCON INTERNATIONAL (NSE: IRCON) — ELLIOTT WAVE + DEMAND ZONETimeframe: Weekly (1W)
Chart price: ₹104.56
IRCON has corrected sharply from its 2024 peak near ₹351.60. The current chart presents a potential complex Elliott Wave correction, with the marked W–X–Y structure suggesting that the decline may be developing as a combination correction.
1. Potential Corrective Structure: W–X–Y–Z
Wave W: The first major corrective decline following the peak.
Wave X: An intervening recovery that temporarily interrupted the downtrend.
Wave Y: A subsequent decl
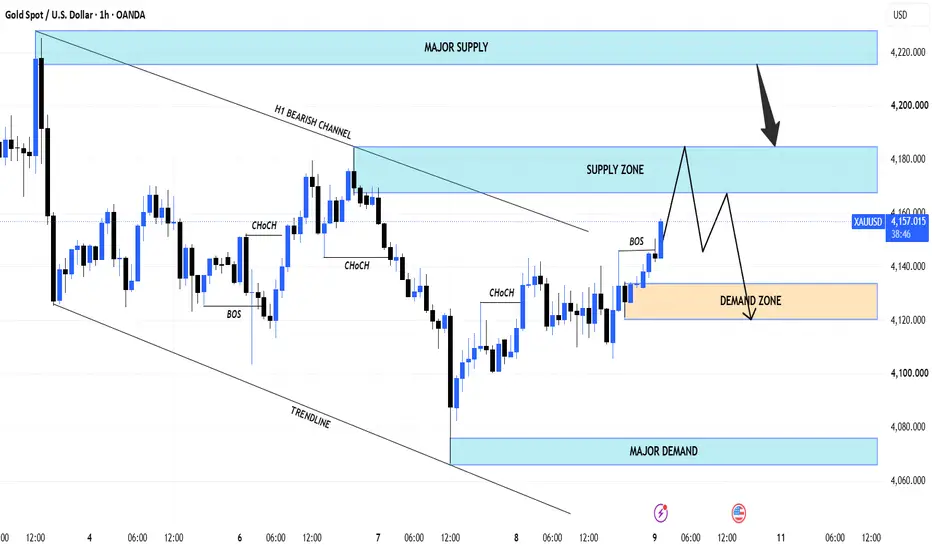
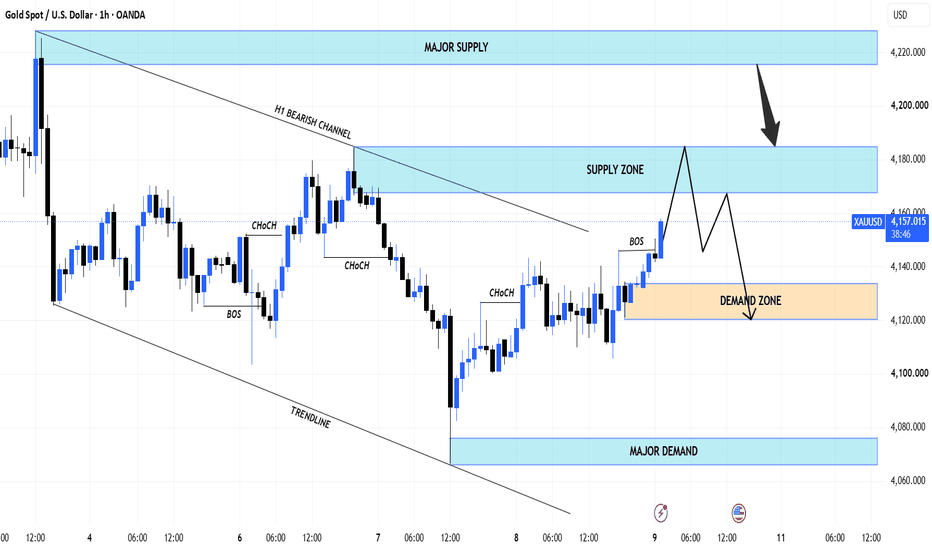
H1 Bearish Retest From Supply
XAUUSD is trading around 4,143 after recovering from the recent liquidity sweep near 4,085–4,100. Short-term structure has improved with a fresh BOS, but price remains inside the broader H1 bearish channel, so the current rebound is still corrective until higher resistance is reclaimed.
Gold recovered modestly on Thursday after touching a two-month low, with spot bullion rising about 0.4% to $4,126.78. Elevated Treasury yields and the strong dollar remain key headwinds, although concerns over U
H1 Pullback Into Support Before Recovery
XAUUSD is trading around 4,160 after recovering from the lower boundary of the current H1 structure. Price has returned to the 4,150–4,164 Major Demand Zone, but the chart still suggests that a deeper liquidity pullback toward the lower support area may occur before a cleaner recovery develops.
The macro backdrop has turned more supportive for gold after the latest U.S. labor report. September nonfarm payrolls increased only 29K versus 90K expected, unemployment rose to 4.2% from 4.1%, and annu
H1 Major Demand Recovery Toward Reclaim
XAUUSD is trading around 4,141 after a sharp rejection from the 4,215–4,225 upper supply area. Price has returned to the lower boundary of the current rising H1 structure, where the 4,118–4,128 Major Demand / Channel Support Zone becomes the key decision area.
The latest U.S. labor data weakened significantly. September nonfarm payrolls increased by only 29,000, versus roughly 90,000 expected, while unemployment held at 4.2%. That reduced expectations for another Fed hike at the October meeting
H1 Major Demand Recovery Setup
XAUUSD is trading around 4,144 after the latest recovery failed beneath the descending dynamic resistance and produced a fresh MSS lower. Price is now moving back toward the 4,105–4,120 Major Demand / SSL Zone, which becomes the key H1 decision area.
The macro picture is becoming more balanced for gold. August U.S. PCE inflation rose 0.3% MoM, below the 0.4% consensus, while annual core PCE was 3.0%. That softer print reduced the market-implied probability of an October Fed hike to roughly 39%,
H2 Major Demand Recovery SetupXAUUSD is trading around 4,284 after extending the bearish move below the rising intraday trendline. Price has already broken the 4,290 area and is moving closer to the deeper 4,235–4,250 Major Demand / Support Zone.
The macro backdrop remains a headwind for gold. Spot gold was around $4,282 early September 24 as markets increased expectations for additional Fed tightening. U.S. business activity reached its strongest level in more than five years, while persistent price pressure reinforced con
H1 Bearish Retest Toward Major Demand
XAUUSD is trading around 4,336 after another rejection from the descending bearish trendline and the lower edge of the 4,365–4,378 Resistance / Supply Zone.
The latest macro backdrop remains difficult for gold. The Fed raised the federal funds target range by 25 bp to 3.75%–4.00% on September 16 and said inflation remains elevated. Reuters reported on September 22 that gold remained pressured as markets leaned toward a higher-for-longer rate outlook, with futures pricing roughly a 90% chance
H1 Bearish Retest From Major Supply
XAUUSD is trading around 4,366 after the latest recovery stalled beneath the 4,390–4,410 Major Supply Zone. H1 structure has improved through the recent MSS and BOS, but price is still trading underneath the broader bearish trendline and a major resistance cluster.
The macro backdrop also remains challenging for gold. The Fed raised the federal funds target range by 25 bp to 3.75%–4.00% on September 16 and said inflation remains elevated. On Monday, gold eased toward $4,370, while the U.S. 2-
SHALBY Is Sitting On A Major Demand Zone — What Next?After months of lower highs, SHALBY has finally reached an important demand area where buyers have reacted before.
The interesting part is that RSI has also moved into the oversold zone and is now showing signs of recovery.
I’m not looking to chase the stock at current levels.
The zone I’m watching is ₹141–135 . If price retests this area and buyers continue to defend it, we could see a move back towards the next major resistance zone.
THE SETUP 👇
Demand / Order Block: ₹135–141
Curren
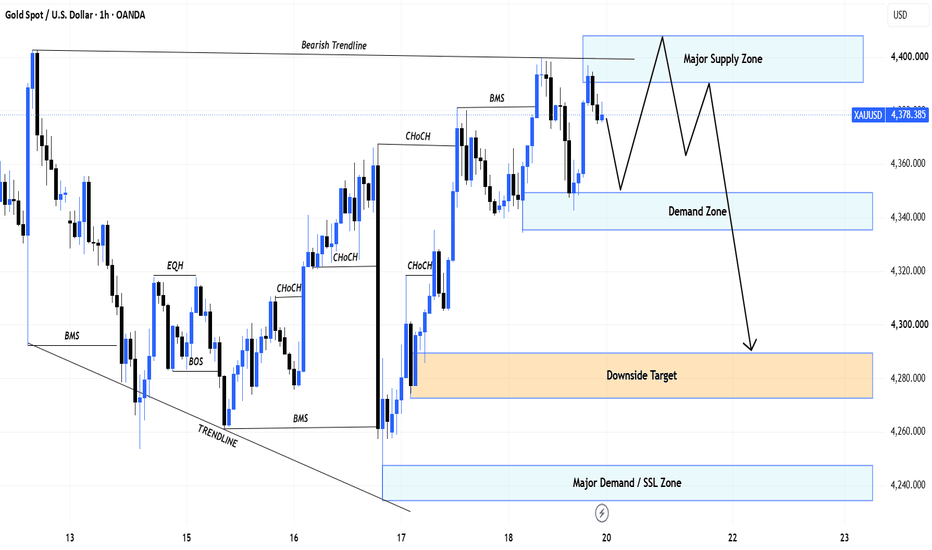
H1 Major Supply Rejection Toward Lower Liquidity
XAUUSD is trading around 4,378 after extending its recovery from the lower H1 structure. Price has returned directly into the 4,385–4,405 Major Supply Zone, where the broader bearish trendline also remains relevant.
Gold reached a one-week high on Friday as easing crude oil prices reduced part of the inflation pressure that had dominated markets earlier in the week. Spot gold climbed about 1.2%, while softer energy prices helped Treasury yields retreat from their recent highs.
However, the b
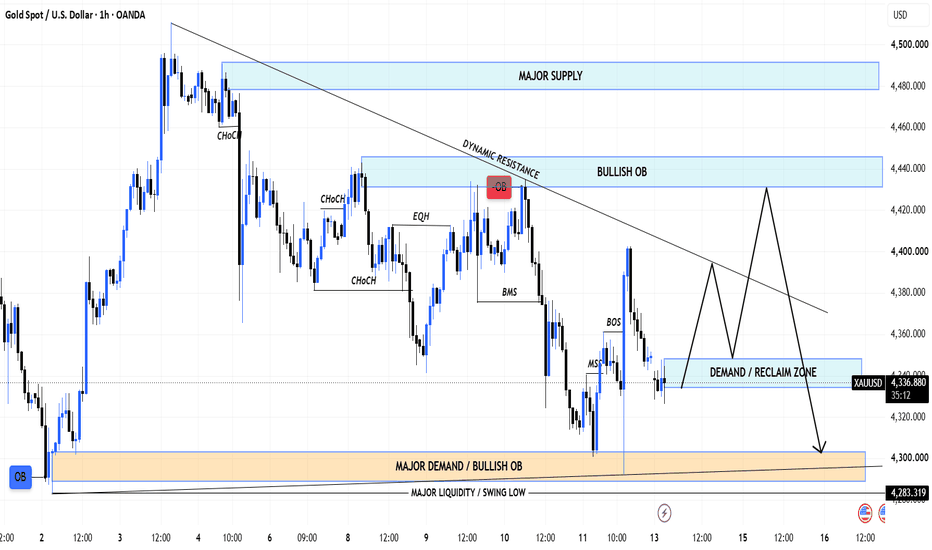
H1 Reclaim Recovery Below Dynamic ResistanceXAUUSD is trading around 4,332 after another selloff into the lower H1 structure. Price is now testing the 4,330–4,350 Demand / Reclaim Zone, but the broader structure remains capped by the descending dynamic resistance.
The macro environment remains difficult for gold. August U.S. CPI rose 0.4% MoM and 3.4% YoY, reinforcing expectations for a Fed hike this week; markets are pricing roughly an 86% probability of a rate increase. At the same time, Brent has surged above $107 amid renewed Middle
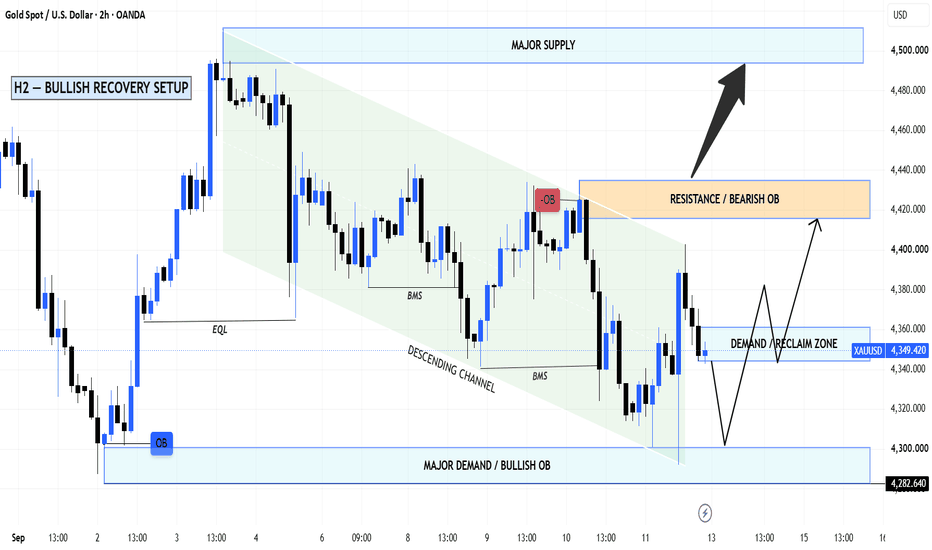
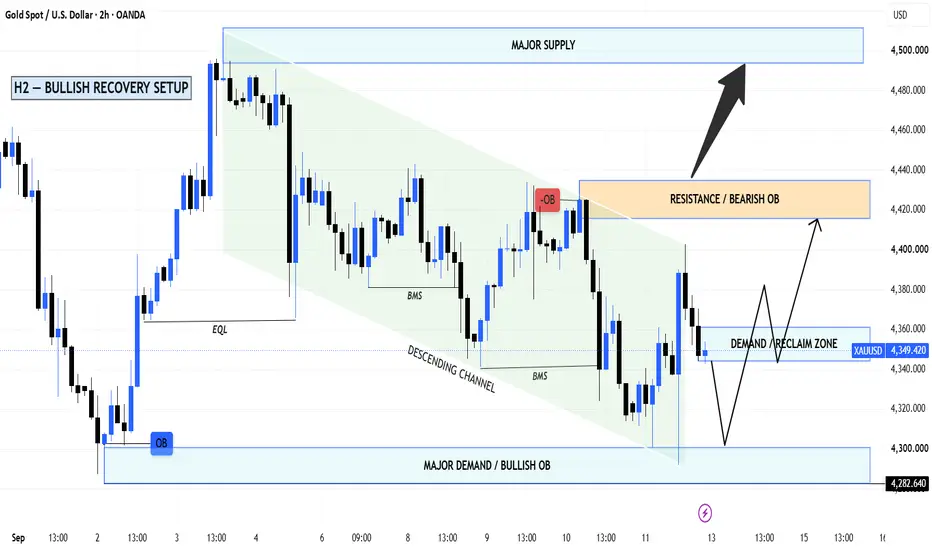
H2 Bullish Recovery From Major Demand
XAUUSD is trading around 4,349 after another volatile session around the lower H2 structure. Price remains inside a broader descending channel, but the current location is close to a major demand cluster where a recovery setup may begin to develop.
The macro backdrop remains challenging for gold. U.S. August CPI rose 0.4% MoM and 3.4% YoY, while core CPI increased 0.3% MoM and 2.4% YoY. Markets now price roughly an 85% probability of a Fed rate hike next week, keeping pressure on non-yielding
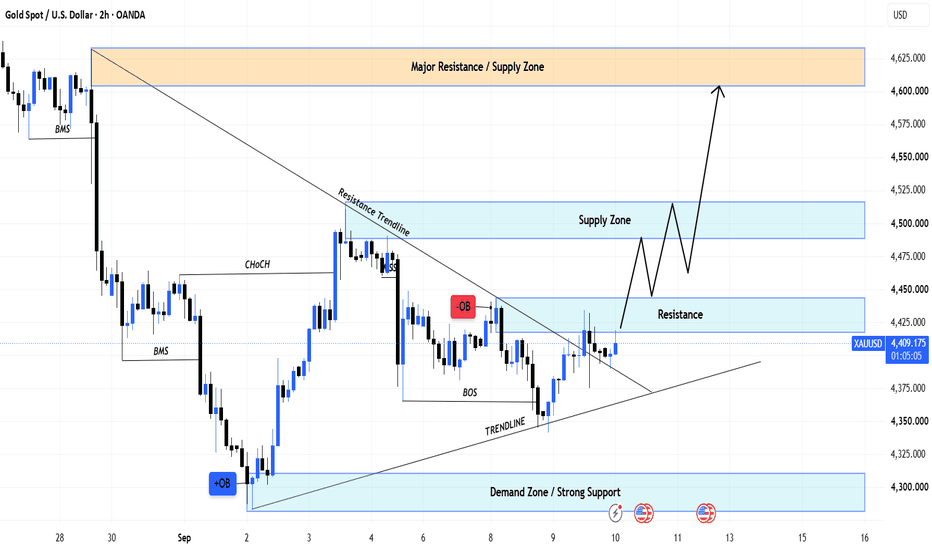
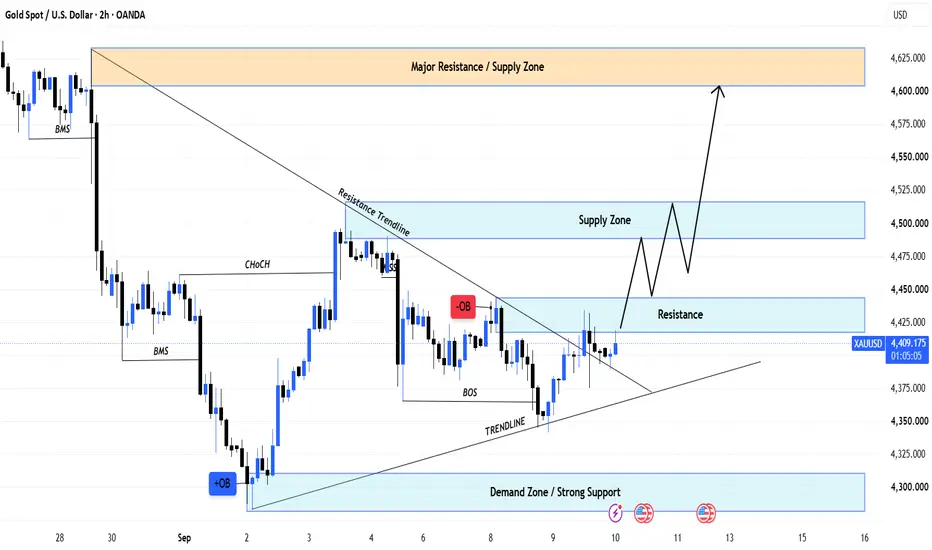
H2 Bullish Reclaim Toward Major Supply
XAUUSD is trading around 4,413 after recovering from the recent 4,350 area and compressing between the descending resistance trendline and rising short-term support. Price is now approaching the first resistance zone, making the next reclaim especially important.
Gold gained more than 1% on Wednesday as the U.S. dollar remained soft, while escalating Middle East tensions pushed Brent above $100. However, the U.S. 10-year Treasury yield climbed toward 4.84%, and markets are pricing roughly a 6
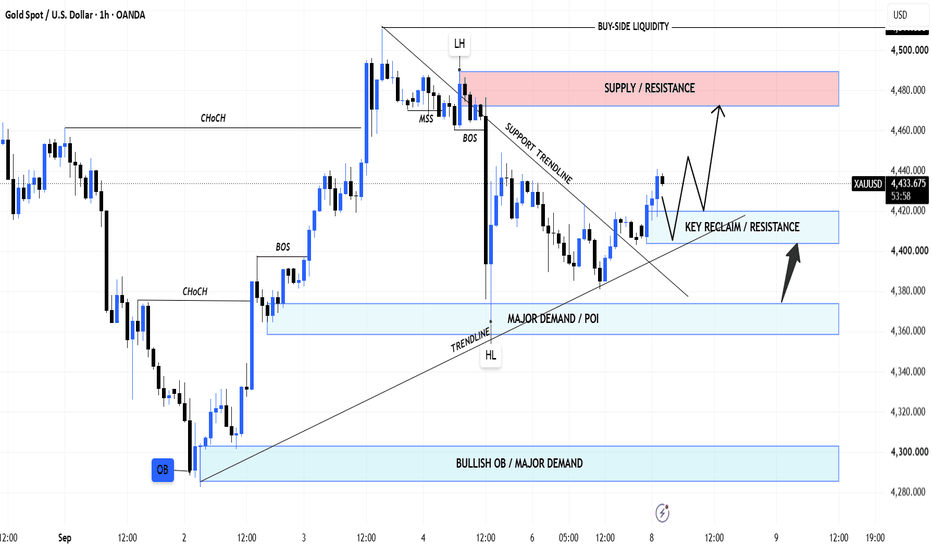
H1 Bullish Reclaim Toward Upper Liquidity
XAUUSD is trading around 4,430 after recovering from the 4,360–4,375 Major Demand + POI and reclaiming the short-term resistance structure. The latest H1 price action is beginning to shift from bearish delivery into a recovery phase, although the market still faces important supply overhead.
The macro backdrop remains mixed. Friday’s strong U.S. payroll report pushed expectations for a September Fed hike to around 60%, but the U.S. dollar is currently subdued as markets wait for fresh inflati
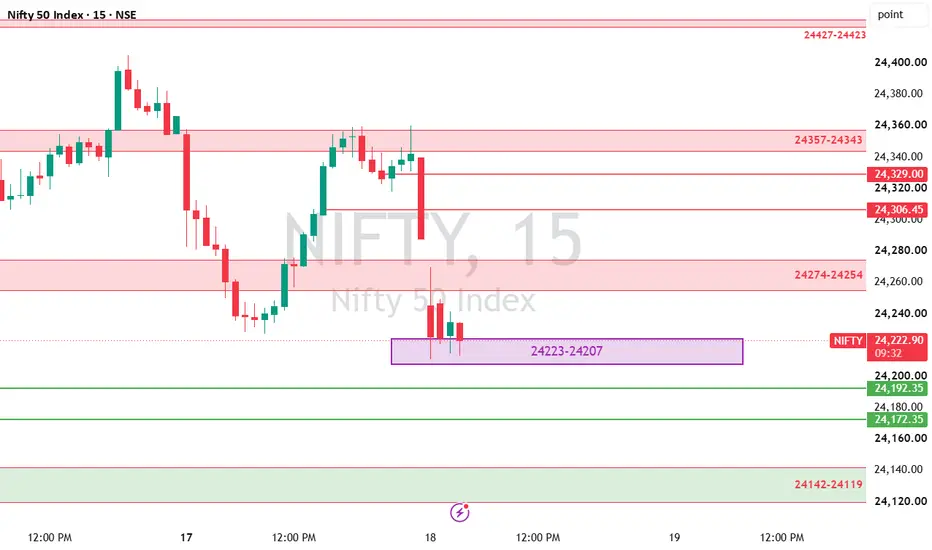
NIFTY 50 Index 15M Technical Analysis – Aug 18, 2026The chart shows the Nifty 50 Index on a 15-minute timeframe, currently trading around 24,225.75. Price has experienced a sharp downward move after failing to sustain higher levels, driving directly into your purple Point of Interest (POI) zone at 24,223–24,207. A clean break below this POI will confirm continuation for your short setup toward lower support targets.
Overhead resistance zones and lines (red) are stacked above at 24,274–24,254, 24,306.45, 24,329.00, 24,357–24,343, and 24,427–24,
Netweb Technologies at 52 week high, now what?This is a study of FVG on weekly timeframe
FVG is Fair Value Gap. It is calculated as gap left between alternate candles. Price usually comes back to fill that gap. Sometimes 50% sometimes 75% sometimes full 100% of that gap.
Netweb consolidated near 3200 levels for several weeks
Breakout came near 3700 area when it created the first FVG1 set this took price to 5200 level within 9 weeks
on the way new sets of FVG were created as shown on the charts.
FVG4 & FVG5 has not been visited.
Rejection
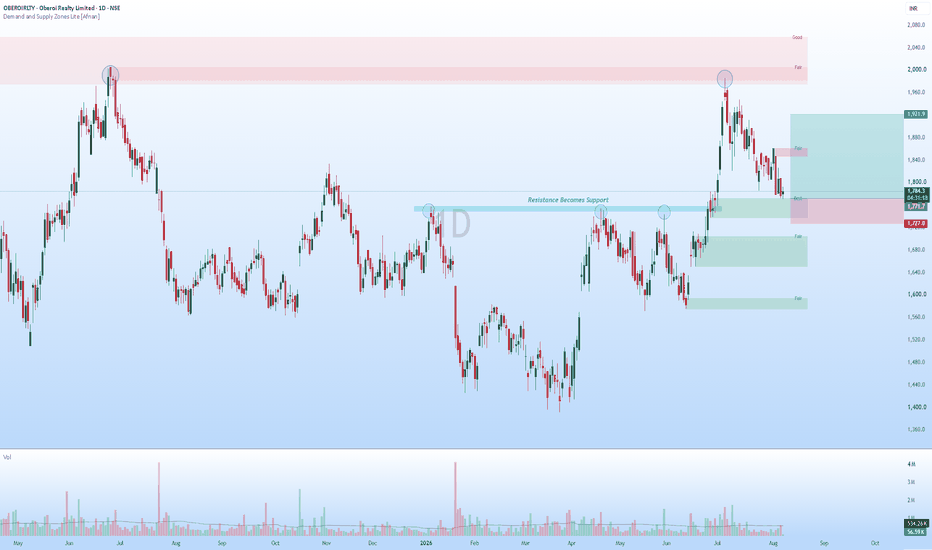
OBEROIRLTY: Supply Worked Perfectly.. Now All Eyes Are on Demand📈 Institutional Zones in Action
Oberoi Realty recently respected a higher supply zone almost perfectly, where fresh selling pressure emerged and pushed the stock lower. This is a textbook example of the Supply & Demand concept, where price moved from an institutional selling zone directly toward an institutional buying zone.
The stock has now reached a high-quality daily demand zone formed after a powerful trend reversal. The zone is backed by a strong leg-out, excellent follow-through, an
Jubilant Foodworks - Can it deliver happiness to shareholders?QSR industry has shown some good volume buying in past couple of weeks.
Jubilant Foodworks (Domino's Pizza) is seen to be bouncing from a strong demand zone.
It has given a weekly closing above 500 which is a positive sign. Stock can test the trendline in next 3-4 months if the momentum continues in QSR stocks.
However, the recent news around FDA raids can hurt the industry and stock price as well. Hence, we might see some volatile price action in the stock.
This is not a recommendation . Idea
Nykaa cmp 328.05 Weekly Chart since listedNykaa cmp 328.05 Weekly Chart since listed
- Support Zone 285 to 320 Price Band
- Resistance Zone 340 to 375 Price Band
- Price trending along High Higher High Lower High closure
- 3 1/2 year Long Rounding Bottom done by Resistance Zone
- Bullish Head & Shoulders made within the Rounding Bottom
- Volumes spiking well above avg trade qty over past few weeks
HINDUNILVR Demand Zone Reversal________________________________________
📊 Hindustan Unilever Ltd. (HUL): Daily Technical Snapshot – Demand Zone Reversal
📊 STWP Technical Analysis
________________________________________
MARKET STRUCTURE SNAPSHOT | NSE: HINDUNILVR | DAILY
Closing Price:2,117.80 (+₹95.10 | +4.70%)
Core Trend: Downtrend (Long-Term Correction)
Market State: Recovery from Major Demand Zone
Price Structure: Price has rebounded sharply after testing a historically significant Demand Zone, indicating renewed buying i
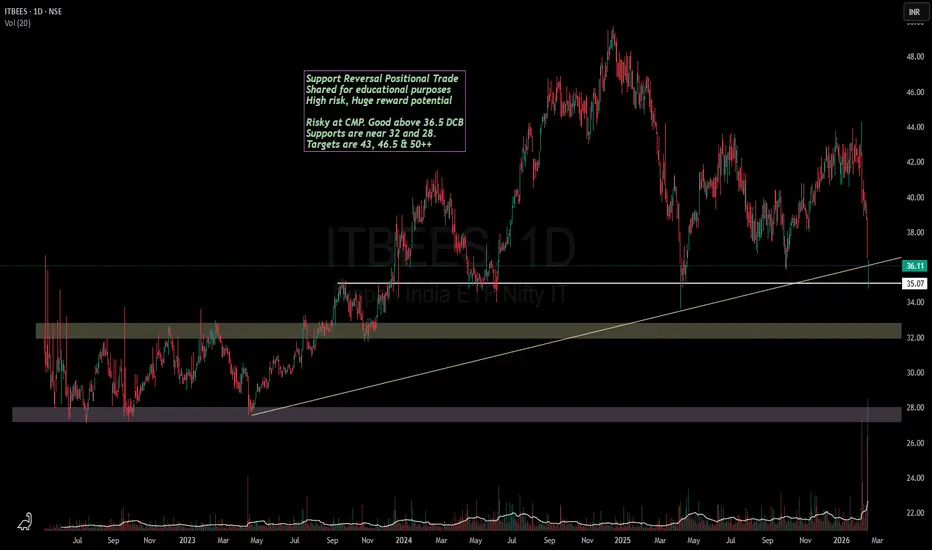
Investing:Nifty IT is looking good for long term accumulation!If you have been following the tech related news lately, it has been about the new AI "revolutionary" tool named Anthropic.
And the same is visible on charts of Nifty IT.
TCS is available at a price at which it was trading in December 2020.
Infy has just broke a crucial support.
Wipro has always been the weakest of 3.
So what next?
My opinion is that the fall is now almost in the end stage. The accumulation has already started on Friday as we have seen some good recovery by end of the day.
Gland Pharma - Has the race to the ATH started?Gland Pharma has given a good strong weekly breakout of a supply zone and currently consolidating above the breakout zone.
As you can see, the stock has clearly formed a beautiful VCP pattern.
Key levels to watch are mentioned on the chart.
A weekly closing above 2600 will be a strong confirmation of strength of buyers.
I had previously posted ideas (check similar ideas links) of Divis Lab & Laurus Labs. They had similar pattern visible on chart and they later went on to make a new ATH .
So, c
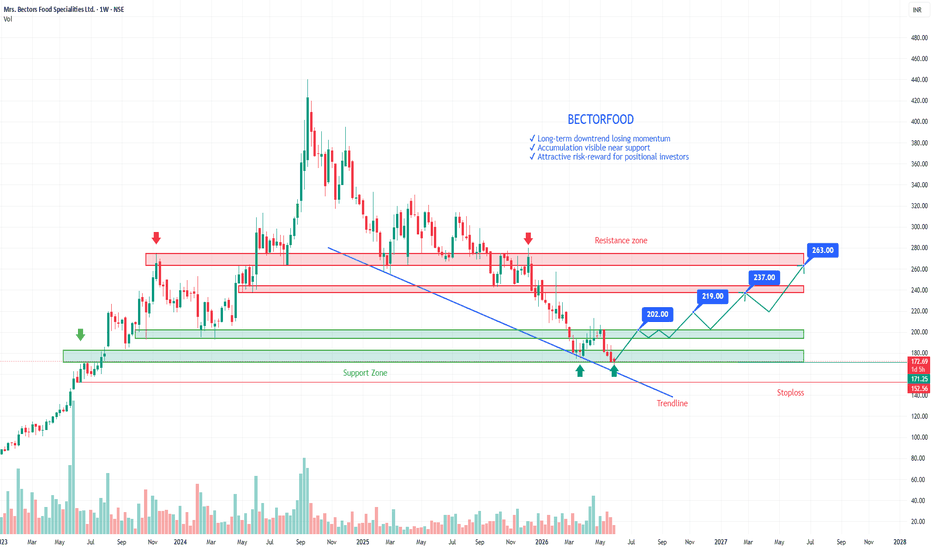
BECTORFOOD: Demand Zone Reversal | Positional Upside Towards 263BECTORFOOD is showing signs of a strong reversal after a prolonged correction, with price currently trading near a key multi-year demand zone.
Entry Zone: 170–173
Why I'm Bullish:
✔ Strong demand zone at ₹175–₹200 with multiple successful retests
✔ Price finding support near long-term trendline confluence
✔ Higher-low structure indicating weakening selling pressure
✔ Signs of accumulation near the lows
✔ Favorable risk-reward for positional investors
Targets:
🎯 ₹202 → ₹219 → ₹237 → ₹26