$TON Alert: FVG, Accumulation Range & Bullish Roadmap ExplainedCRYPTOCAP:TON Traders Alert: FVG Zone, Accumulation Range & Bullish Roadmap Explained!
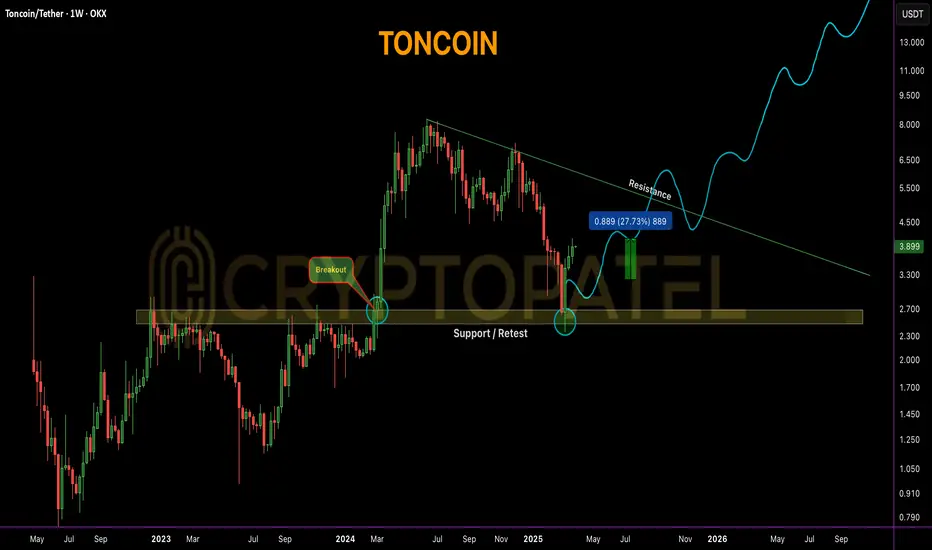
#TONCOIN is currently trading around $3.90, up +27% from our earlier entry near $3.20.
🔹 Scalpers may consider booking partial profits at current levels due to short-term resistance zones.
Key Levels:
🔹 Support: $2.50, $2.95–$3.33 (FVG zone), $2.50 (major demand zone)
🔹 Resistance: $4.15 – $4.50 (next breakout levels)
FVG Zone (Daily TF): $3.33 – $2.95
If price revisits this imbalance zone, it may offer a high-probability entry opportunity.
Long-Term View: As the native token of Telegram’s TON blockchain, #TON has strong utility. If adoption continues, potential upside targets could be:
Targets: Mid-Term: $10+ | Long-Term: $50 – $100
Accumulation Zone (for long-term investors): $3.50 – $2.50
Price bounced strongly from $2.50, confirming it as a solid base.
⚠️ This is not financial advice. Always DYOR before investing.
Search in ideas for "CRYPTO"
Will TON/USDT Hit $100 in Near Future? $TONCOIN – Technical Analysis Update
CRYPTOCAP:TON is currently displaying a bullish structure, following a strong bounce from the key support/retest zone at $2.50.
🔹 Support Zone: $2.50
🔹 Accumulation Range: $3.50 – $2.50
🔹 Trend Outlook: As long as price sustains above $2.30–$2.50 zone, the structure remains bullish.
📈 Potential Upside Targets:
▪️ $20
▪️ $30
▪️ $40
▪️ $50
▪️ $100 (macro target on long-term breakout)
🔻 Invalidation Level (Bearish Bias):
If CRYPTOCAP:TON breaks below $2.30 and fails to reclaim it, bearish momentum may resume.
📝 Disclaimer: This is a technical analysis view, not financial advice. Always DYOR before making any investment decisions.

$BNB will hit 4 digit in this bull run🚨 Mark my words! 🚨
If you’re not buying CRYPTOCAP:BNB in 2025 between $500-$600, you’ll regret it later!
Once the altseason kicks in, BNB will be a 4-digit coin—STABLE! 💰🔥
Don’t say I didn’t warn you! 🚀📈
NFA & DYOR

Bitcoin Big Decision: $100k Breakout or $75K Drop?#Bitcoin Big Decision: $100k Breakout or $75K Drop?
🔰 Key Levels:
▪️ $100k Resistance: CRYPTOCAP:BTC is showing weakness around this psychological level due to low trading volume.
▪️ Swing Low Support: $95,650 – A breakdown here could signal bearish momentum.
▪️ Trendline Resistance: $94,100 – Breaking below this level may lead to a 10%-20% correction.
🔰 Bearish Outlook:
If #BTC breaks both $95,650 and $94,100, downside targets are $85,000 and $75,000.
🔰 Bullish Case:
If BTC holds above $94,100, a continuation toward $120K is possible, supported by volume.
⚠️ Risk Management: Current volatility is high. Traders should monitor these key levels closely and use stop-loss orders to mitigate risks.

Bitcoin need Short term Retracement 🔹 #Bitcoin LTF Update 🔹
CRYPTOCAP:BTC has formed a double top on the LTF, signaling bearish potential below $90,000. This could mean a short-term retracement.
If #BTC fails to break the $90,000 resistance, we may see it drop to the $81,000 level soon, with LTF OB around $81,000.
However, if BTC breaks above $90,000, next stop could be over $100k 🚀

Will Bitcoin History Repeat after US Election ?#Bitcoin and US Elections: History Repeats?
Looking back at the last two US elections, we’ve seen a strong Bitcoin bull market follow each one. Let’s take a look:
📅 2016 US Election (November):
➡️ Before the election, BTC was at $700
➡️ Within a year, BTC soared to $19,900
📅 2020 US Election (November):
➡️Pre-election price: $13,600
➡️ Just a year later, BTC hit an all-time high of $69,000!
Now, with the US election tomorrow, is this another CRYPTOCAP:BTC buying opportunity based on past trends?
🔮 My Prediction: By next year, November 2025, #BTC could reach $150,000 - $180,000.
Let’s see if history repeats!
#Crypto #BullMarket

#Ethereum Breakout: Will ETH ETF Decision Propel Prices to $6000#Ethereum Eyes Breakout: Will ETH ETF Decision Propel Prices to $6000?
CRYPTOCAP:ETH is showing bullish signs with a falling wedge/bull flag pattern and a strong bounce off support.
ETH ETF decision on Thursday. Deadlines for 4 ETF issuers are at the end of this month, starting May 23rd.
Potential Targets:
- Approval: #ETH could soar to $5000-$6000.
- Rejection: ETHUSDT might drop to $2500-$2000.
Conversely, a rejection, especially if based on the classification of tokens as securities, could lead to a downturn in ETH and #DeFi assets.
Strategy: Consider a spot long position, but avoid excessive leverage due to potential volatility.
Stay informed and trade smart.

$WIF Elliott Wave Analysis ( Target $20 As Per EW )CRYPTOCAP:WIF Elliott Wave Analysis
- The current EW 5-wave cycle appears complete, entering A-B-C correction.
- Post C-phase correction, anticipate a significant upward rally towards $16-$20 (1200% potential).
- Correction Target: Expecting a dip to 0.382 Fibonacci level ($1.60-$1.30).
- Worst Case: Exit strategy if price breaks below the bull flag's red line.
Stay tuned for updates.

Can $RNDR Hit $50? #RNDRUSDT Analysis:RNDR/USDT Chart Analysis
Bullish Outlook:
CRYPTOCAP:RNDR has shown impressive returns: 34x in a year and 10x in the last 7 months. However, given its impressive gains, current investment in RNDR/USDT carries high risk.
Technical Analysis:
The current weekly candle indicates a strong bounce back from support, signaling that RNDR remains bullish as long as it holds the $7 support level.
If RNDR maintains this support, it could reach new all-time highs (ATH) and potentially rise towards the $50 mark. The RNDR project has strong potential for further growth.
Bear Case Analysis:
➡️ If RNDR breaks the $7 support, consider accumulating around the $3.5-$4 range, which serves as a significant support level.
Takeaways:
➡️ Monitor the $7 support level closely.
➡️ Consider the risk involved due to recent high gains.
➡️ If the support holds, RNDR has the potential to soar, but breaking the support could offer a good buying opportunity at lower levels.
Follow me for latest analysis on real time.

Ethereum Technical Analysis Update#Ethereum Technical Analysis Update
Chart Pattern: Bull Flag Formation
Ethereum is showcasing a classic bull flag pattern on the ETH/USDT chart. This is often a bullish continuation pattern, indicating potential upward momentum if the market conditions align.
Key Breakout Level: $3,250
If Ethereum breaks and holds above the $3,250 resistance level, we are likely to witness a significant rally. A successful breakout could potentially set CRYPTOCAP:ETH on a path to a new all-time high! Keep an eye on this crucial level for decisive moves.
Support: $2,750
Resistance: $3,250
Trade Wisely and Always Use Stop Loss.

ETHEREUM Chart Analysis before Halving #ETHEREUM CHART ANALYSIS
Current Price: $3040
Pattern Formation: Bull flag with strong support at $2900
Potential Scenario: A bounce could drive CRYPTOCAP:ETH to $3250, while rejection might lead to a retest of $2000 levels.
Important Levels to Watch:
Support: $2900 / $2200
Resistance: $3250
Keep a keen eye on these critical levels

What's Next for Bitcoin? Understanding Its Current Price MovesWhat's Next for Bitcoin? Understanding Its Current Price Moves
#Bitcoin Market Brief
Current Status: CRYPTOCAP:BTC is trading near $64,000 amid recent declines. Bearish trends dominate due to global uncertainties affecting crypto markets.
Key Levels:
Support: Watch $63,800. Falling below could lead us to $51,000.
Resistance: Key resistance at $67,600. Below this, expect continued bearishness.
Observations: Recent charts show a trendline breakout and retest, suggesting a possible further drop. Stay alert to these patterns for trading cues.
Action Points: Maintain strict stop-losses to minimize risks. A break above $71,000 could shift momentum to bullish, signaling a potential new ATH.
Suggestion: Focus on technical analysis and update strategies with market changes. Keep an eye on global news that could sway crypto prices.
Looking Ahead: A climb over $71,000 might set the stage for new record highs.
Keep tuned for updates.
#BTC #Cryptocrash

Bitcoin Symmetrical Triangle Fake breakout#BitcoinUpdate | CRYPTOCAP:BTC Trading Insights
Current Formation: CRYPTOCAP:BTC is sculpting a Symmetrical Triangle, suggesting a pivotal movement ahead.
Recent Activity: Noticed a Fake Breakout with $BTC/USDT, reverting to trade within the Symmetrical Triangle.
Bearish Alert: Caution if #BTC plunges below $65k. This level is a critical juncture for future trends.
Strong Support: Steadfast at $65,000. Bulls dominate above this threshold.
Trading Strategy: Hold your trades until a clear Symmetrical Triangle Breakout. Patience is key.
Bullish Outlook: An upward breakout could signify a monumental bull run for Bitcoin.
Engage & Share: RT/Like if you find this setup aligned with your market expectations. Let’s ride the wave together!

WIF/USDT Ready for Big Pump or Big Dump ?Trading CRYPTOCAP:WIF ? Here’s How to Win Big or Stay Safe
➡️ Easy Trading Tip: #WIF chart is clearly going up, making it a good choice for easy trades.
➡️ Strong Support: Rebounded from $3.20, showing strong support.
➡️ Next Goal: Staying in the channel could push us to $7 target.
➡️ Watch Out: If it drops below $3, consider exiting long positions.
➡️ Skyrocketed: From $0.17 in Feb to an ATH of $4.91 in March ( 28x in 2 months )
➡️ Risk vs Reward: High risk, but a tight stop loss could mean smart gains.
#Altcoins #Dogwifhat

Bitcoin Elliott Wave Count ( bullish Toward $200k )#Bitcoin Elliott Wave Analysis CRYPTOCAP:BTC
According to Elliott Wave counting, if things go as predicted, we could see prices hitting $160,000 to $180,000 really soon
RT/Like if you Agree with My EW Setup
NFA #BTC

#ETHEREUM Chart Update #ETHEREUM Chart Update
CRYPTOCAP:ETH is currently testing its support level.
We're keeping an eye on it!
If it falls below this support, it might not look good for the market for a bit.
I think we might see a lot of ups and downs leading up to the halving.
Stay tuned!
#ETH #Altcoins

#BITCOIN WEEKLY CANDLE ALERT #BITCOIN WEEKLY CANDLE ALERT
In just 7 hours, #BTCUSDT is on the brink of making history.
Aiming for its highest weekly/monthly close EVER, and the first ever above previous cycle's peak!
Previous Highest Weekly Close : $68,951
Need to Close above $69,000
Will #BTC make Highest Weekly/Monthly Candle ?
CRYPTOCAP:BTC

#ETHEREUM READY FOR NEW ALL TIME HIGH #ETHEREUM READY FOR NEW ALL TIME HIGH
1⃣ Breakout Triangle Resistance & did Perfect Retest
2⃣ Also Formed Inverse H&S Pattern NECKLINE Breakout & Retest Done
3⃣ CRYPTOCAP:ETH Must Hold $3450 Support for New ATH
4⃣ Next Targets Would be $4068/$5000
5⃣ Always Use Stop Loss as per your Risk Reward Ratio
Share/Comments if you agree with My Setup.
NFA

#ETHEREUM READY FOR BIG DUMP?#ETHEREUM READY FOR BIG DUMP?
1⃣ CRYPTOCAP:ETH Broken TL and Retest also Completed ✅
2⃣ Targets: $3261 & $2906 ( Red TL = Resistance )
3⃣ Stop Loss: If Candle Close Above Red TrendLine
4⃣ Already Gave 14% TP in Spot. ( Risk Reward: 1/3.5 )
5⃣ Long Term I am Always Bullish & Will try to Add at Every big Dip
6⃣ My Trade Now in 57% Profit

ETH/USDT Ready for Big Dump ?#ETHEREUM READY FOR BIG DUMP?
1⃣ CRYPTOCAP:ETH Broken TL and Retest also Completed
2⃣ Targets: $3261 & $2906 ( Red Box = Resistance )
3⃣ Stop Loss: $3940 ( Hard SL = $4094 )
4⃣ Risk Reward: 1/3.5
5⃣ Long Term I am Always Bullish & Will try to Add at Every big Dip

ETHEREUM BULL RUN ROADMAP#ETHEREUM BULL RUN ROADMAP
1⃣ CRYPTOCAP:ETH Printed 2nd Highest Candle after Jan 2021
2⃣ Only 41% Away from ATH
3⃣ Strong Support = $2200-$2000
4⃣ High Chances to Approved Spot ETH in May 2024
5⃣ Bull Market Targets = $8000/$12000/$15000
6⃣ Below $2500 = Huge Buying Opportunities
NFA & DYOR

Bitcoin Bull Flag Analysis: Wait for Confirmations#Bitcoin Bull Flag LTF Chart Analysis:
CRYPTOCAP:BTC Currently Trading in Bul flag as per 2H Chart.
This is a Bullish Pattern but not open any trade before Confirmations,
Bullish Breakout Point: $52,800
Bearish Breakout Point: $50,800
Confirmations: Await 2H candle close above/below range

BITCOIN Inverse H&S Pattern Target achieved#Bitcoin Inverse H&S Targets Update:
CRYPTOCAP:BTC Perfectly Hit our Targets zone after successful breakout.
TP1:- $47,090 ✅
TP2:- $49,225 ✅
Recent High:- $53,000 ✅
So #BTC did 21% after Clear Breakout.
Happy Trading.
