Bitcoin Weekly Closed is Epic so Ready for Massive Run?Epic Weekly Close for Bitcoin!
BTC is gearing up for a massive run
If BTC holds above $56,570, we could see an impressive rally soon!
Keep an eye on the charts as history suggests sustained breakouts lead to significant gains.
#BTC #Bitcoin #Crypto #CryptoAnalysis
Search in ideas for "CRYPTO"

Catch the Wave: RNDR/USDT Analysis & Potential $50 TargetCatch the Wave: RNDR/USDT Analysis & Potential $50 Target
Elliott Wave Count Insight
CRYPTOCAP:RNDR is currently showing signs of forming an Elliott Wave pattern, suggesting a potential correction in the near future. Our analysis indicates that there might be further correction ahead.
Previous Analysis Recap
In our last analysis when #RNDR was around $10, we accurately predicted a 4th wave correction, which has since been fulfilled.
Current Scenario and Entry Opportunities
There's a strong support level anticipated at $5-$6, representing the 0.382 Fibonacci retracement. This suggests a potential bounce for the 4th wave from this support zone, presenting favorable entry opportunities.
Price Target Projection
Should our wave count analysis hold, we anticipate RNDR's price to potentially reach $50 in this bullish cycle.
Alternative Scenario
In case RNDR fails to maintain the 0.382 Fibonacci level, we recommend considering entry points around $2.5-$3.5.
Remember, trading involves risks. Always conduct your own research and consider your risk tolerance before making any investment decisions.

FET/USDT Bull Market $10 Potential?This BULL MARKET NYSE:FET will give really huge Returns IMO
Big Dip means buying opportunities.
My Long Term Target: $10
Best Accumulation if dip: $0.4-$0.3
#cryptomarket #FET

LTC/USDT Ready for $500?#Litecoin Bull Market $500 Target
Short-Term: Brace for some dips!
Accumulation Zone: Keep an eye on $30-$50
Long-Term Potential: Target in Next Bull Run: $500-$1000
Critical Levels:
Resistance: $117/$376
Support: $50/$35/$25
Support = Entries ( Buy the Dips )
Opinions, not advice. Do your research!
Share & Follow for more crypto GEM Analysis.

Arbitrum $10 Potential in Bull Market if Breakout this Resistanc#Arbitrum Hits New All-Time High
LSE:ARB has just reached a new ATH of $1.84, currently trading at the red box resistance.
If it breaks upward, #ARB could experience super bullish growth.
However, if rejected, there may be more dip buying opportunities around $1.30.
In a bull market, we can envision ARB/USDT price reaching $10.
Our long-term outlook remains bullish.
Support: $1.50/$1.30
Resistance: $1.75
Stay tuned for more updates and insights on Arbitrum's performance!
#Crypto #Bitcoin #Bullmarket

ETHEREUM Broken Bull Flag so Now Target is $2800 as per Chart#Ethereum Market Update: On the Way to $2800!
Current Status:
Ethereum (#ETHUSDT) has shattered the $2300 resistance mentioned in the last post and is now trading above $2400.
Bull Flag Resistance Broken at $2255, with a successful retest at $2200.
Analysis:
Bullish momentum continues, setting the stage for a push towards $2800.
Caution: In the event of a market downturn due to negative news, anticipate a potential retest at $2290-$2300 before the upward journey to $2800.
Critical Levels:
Resistance Broken: $2255
Retest Completed: $2200
Bullish Target: $2800
Important Note:
Sustaining below $2200 may shift #ETHUSDT into Bearish Mode.
Stay tuned for real-time updates!
Join And follow me for More Quality analysis.
Thank you.
#EthereumUpdate #CryptoTrading #ETHAnalysis

ARB/USDT 30% Potential in Scalp TradeARB/USDT Trade Analysis
Bullish Trend Alert!
ARB is showing promising signs in the bullish trend, setting the stage for potential gains. If the price manages to hold above the $1.10 level, we could be looking at a lucrative opportunity with a potential profit range of 10-30% within the next few days.
Trade Strategy:
For the best entry, consider buying near the support level of $1.10. This level serves as a crucial point for potential upward momentum.
Key Levels:
Support: $1.10
Resistance: $1.50
#Crypto #Arbitrum

Bitcoin Dump so What Next?#Bitcoin
Is this just a market hiccup before the big #crypto rally kicks in?
Brace for impact – the calm before the storm!

GRT/USDT Technical Analysis Chart Overview#GRT/USDT Chart Analysis
Bullish Breakout Confirmed!
Now patiently waiting for the retest for the optimal entry.
- Entry Levels: $0.145-$0.150
- Targets: $0.160, $0.170, $0.183
- Stop Loss: $0.140
- Trade Time Period: 0-15 Days
Seize the opportunity wisely!
#CryptoTrading #GRT #Bullish #TechnicalAnalysis

#XRP/USDT 1HOUR UPDATE BY CRYPTOSANDERS !Hello, dear traders welcome you to this XRP/USDT1hr chart analysis.
I have tried my best to bring the best possible outcome in this chart.
Hello dear traders, we here new so we ask you to support our ideas with your LIKE and COMMENT, also be free to ask any question in the comments, and we will try to answer for all, thank you, guys.
XRP/USDT Ascending Trendline Create and triangle inside and triangle up said breakout and bounce.
XRP/USDT is parallel channel trading inside and bounces triangle pattern down tradeline and bounce. and 20% pump
Remember:-This is not a piece of financial advice. All investment made by me is at my own risk and I am held responsible for my own profit and losses. So, do your own research before investing in this trade.
Thanks for your time, we hope our work is good for you, and you are satisfied, we wish you a good day and big profits.
THANK YOU...

$TRUMP TOKEN: A 92% MASSACRE IN JUST 316 DAYS$TRUMP TOKEN: A 92% MASSACRE IN JUST 316 DAYS: WHAT THE HELL JUST HAPPENED? 😡
Let’s talk about the BRUTAL reality of celebrity/president tokens:
THE NUMBERS DON’T LIE:
🔹 ATH: $79.70 (January 19, 2025)
🔹 TODAY: $5.69 (December 1, 2025)
🔹 DOWN 92.58% IN LESS THAN A YEAR
316 DAYS: Not even a full year and your portfolio is DESTROYED.
THE REALITY CHECK:
If you bought $1,000 at ATH → Your bag is worth only ~$71 TODAY 💀
WHO PROFITED?
✅ Early insiders who dumped on retail
✅ VCs who got free or discounted tokens
✅ Influencers who promoted and then silently exited
WHO GOT REKT?
❌ Retail investors who FOMO’d at the top
❌ Newbies who trusted the hype
❌ Anyone who didn’t take profits
MY REPEATED WARNING:
NEVER INVEST IN INFLUENCER/PRESIDENT TOKENS!
This is exactly why I keep saying:
🔹 Don’t chase celebrity coins
🔹 Your money is HARD-EARNED
🔹 These are pump & dump schemes disguised as “movements”
Is this crypto or a 3rd class memecoin casino? YOU DECIDE.
LESSON: Hype doesn’t pay bills. Due diligence does.
STAY SAFE. TRADE SMART. PROTECT YOUR CAPITAL.
NFA & DYOR

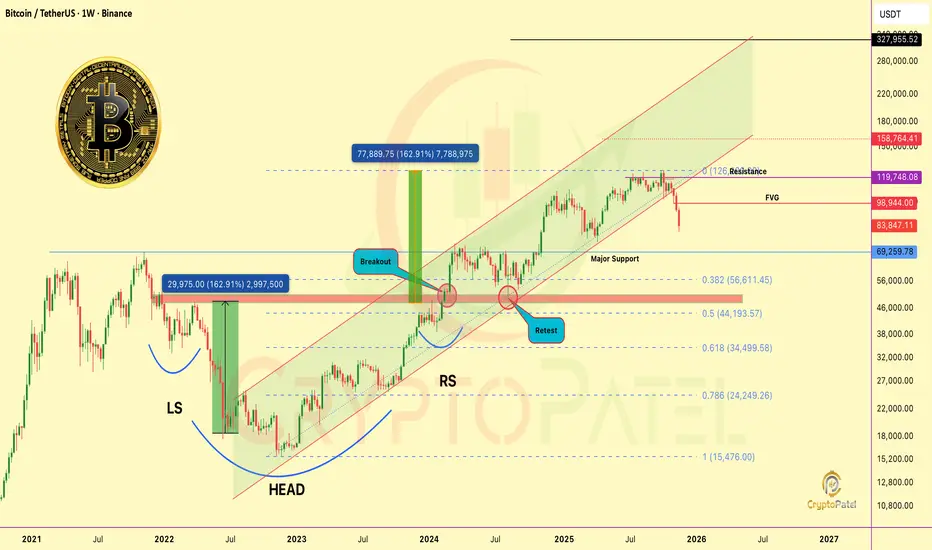
STOP SCROLLING: BITCOIN TECHNICAL ALERT (3-Year Support Break)🚨 STOP SCROLLING: BITCOIN TECHNICAL ALERT (3-Year Support Break) 🚨
Bitcoin has broken a long-term support channel that’s been respected since 2022. That multi-year channel support was around $108,000 and I warned there to protect capital and trade safe.
Result: Breakdown.
✅ BTC dumped over -25%
✅ Now trading near $83,000
Structure Still Bearish
Trend remains bearish unless BTC reclaims the broken channel.
A Relief bounce is still possible toward: $93,000 / $98,000
But treat that as corrective unless structure flips.
Major Support: $69,000 is a critical level, Last bull-run ATH and strong demand zone. Watch it closely.
If This Channel Break Plays Out Fully…
As a Technical Analyst, I can’t sugar-coat the math.
When a multi-year channel breaks, the natural downside targets usually align with major Fibonacci retracement zones:
Deep Retracement Targets (Bear Case)
0.5 Fib: $44,193 (~60% probability)
0.618 Fib: $34,500 (~30% probability)
0.718 Fib: $24,250 (~10% probability)
These aren’t fantasies. They’re standard TA outcomes after this type of structural failure.
Important: This Is Not Panic
I’m not here to spread fear.
I’m here to state what the chart is objectively signaling.
Markets don’t move on hope, They move on structure, liquidity, and trend mechanics.
If price goes into that 0.5–0.718 Fib zone, it would be painful short-term…
but also a once-in-cycle accumulation window for long-term holders.
CryptoPatel Note:
Believe me, I want BTC at $1M+ in the future.
But wanting isn’t analysis.
My job is to map both paths: bullish and bearish, Before they happen.
Save this post. Mark the levels. Trade safe.
Because when a 3-year support breaks, the market doesn’t whisper, it screams.
NFA & DYOR
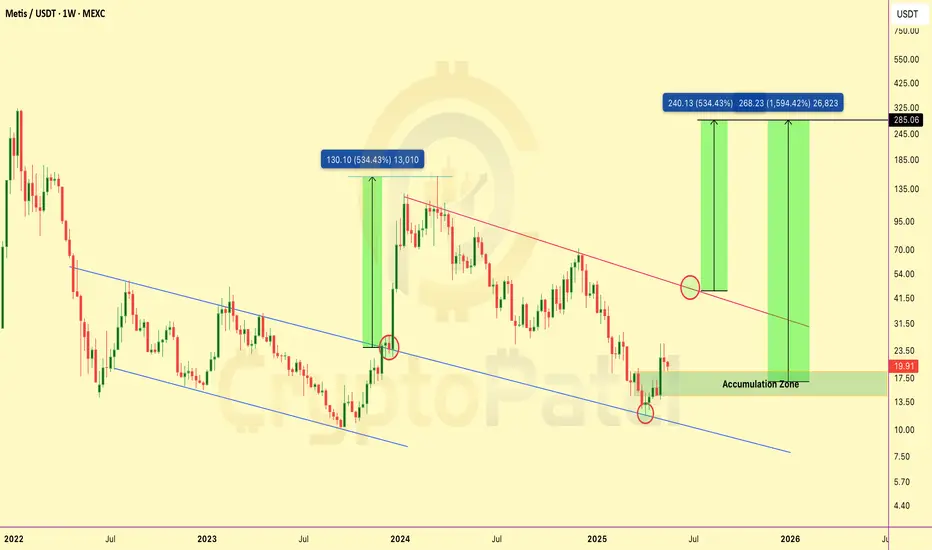
This Hidden Gem Could 10x–20x — Why I’m Buying $METIS Now!This Hidden Gem Could 10x–20x — Why I’m Buying SEED_DONKEYDAN_MARKET_CAP:METIS Now! 🚀
SEED_DONKEYDAN_MARKET_CAP:METIS Long-Term Accumulation Plan
SEED_DONKEYDAN_MARKET_CAP:METIS is showing strong long-term potential — I’m starting to buy small amounts now and planning heavier buys in the accumulation zone between $19–$14.
If price holds above $14, we could see a major rally ahead with potential 10x–20x returns.
Long-Term Targets: $50 / $100 / $150 / $200 / $250 / $300
Why I’m Bullish on SEED_DONKEYDAN_MARKET_CAP:METIS :
• Ethereum Layer-2 Rollup focused on decentralization
• Plans to decentralize its sequencer for more security
• Backed by a $100M Ecosystem Fund to attract developers
• Co-founded by Vitalik Buterin’s mother, Natalia Ameline
• Gaining momentum from recent ecosystem news
Reminder: Crypto is highly volatile — always use proper risk management and understand the risk/reward.
📌 Not financial advice — Do your own research.
PEPE/USDT Chart Analysis: Is the Bull Flag Signaling a Breakout?PEPE/USDT Chart Analysis: Is the Bull Flag Signaling a Breakout?
The PEPE token has been drawing attention in the crypto market due to its recent impressive performance. With a current trading price of $0.00000857, it has surged by 1650% in the past seven months and 1160% over the past three months. This meteoric rise has caught the eye of many traders, particularly those interested in technical analysis.
Bull Flag Pattern
Analyzing the chart reveals a potential bull flag formation, a pattern that suggests a continuation of an upward trend after a brief consolidation period. According to this analysis, the breakout has already occurred at $0.00000775. Now, traders are watching for a potential retest around $0.00000750, which could present an attractive entry point.
Price Targets and Risks
If the bull flag pattern plays out as anticipated, the projected target is around $0.000047, representing a 500% increase from the current price. This target hinges on a successful retest and subsequent rally.
However, it’s important to highlight the inherent risks. Investing in PEPE at this stage could be risky given its significant prior gains. For those considering fresh investments, it's crucial to have a stop-loss strategy in place. A strong indication of a trend reversal would be if a higher time frame (HTF) candle closes below the flag channel. In such a scenario, it's recommended to place a stop-loss to protect against potential losses.
Conclusion
While the PEPE token's bull flag pattern suggests potential further gains, the risks should not be overlooked. If you're considering investing based on this pattern, a carefully placed stop-loss can help mitigate potential losses if the trend reverses.

Time to Take Your Money? Tips After $TAO Big Exchange ListingTime to Take Your Money? Tips After GETTEX:TAO Big Exchange Listing
#TAO Hits Binance
Huge props to
@opentensor
for listing TAO on the world's top exchange, sparking an epic season for $TATSU
Peak Price: TAO hit $1,249
Good News for #TATSU : It's looking up because of TAO's success.
Cheers to Early Investors: If you got TAO early, you're in a good spot.
Market Snapshot:
Last 10 Months: +2500% ( 4000% if High Consider )
Last 6 Months: 16x gains
Post-Listing: +35%
Attention: Watch the $550 support. Falling below? Bearish signs ahead.
Strategy Tip: Enjoyed the pump? Consider securing profits. Market dynamics are shifting!
Again Remember Never forget to book profit & Keep tight Stop Loss if you want to Fresh Entry in TAO
#Bittensor #Crypto

ORDI/USDT Chart AnalysisORDI/USDT Chart Analysis
▪️300% Potential From This Level
▪️RED BOX is our SL if Trend Reverse
▪️BULL FLAG in Daily Time Frame
▪️Accumulation Zone: $70-$60
▪️Daily Candle Close below $56 Mean Exit
#ORDI #TechnicalAnalysis #Crypto

ASTRADAO/USDT 10x-50x Potential As per Chart and Project#ASTRADAO 10x-50x Potential Project
I am Expecting ASTRA DAO will be next Gem in Bull Market.
Trying to add very Small Quantity.
Accumulation zone: $0.000000070-$0.000000095
Try to Add in Dip when Market Dump.
ASTRA DAO:
Astra DAO is a decentralized crypto asset allocator on Ethereum, offering convenient investment strategies and products/indices.
The native MYX:ASTRA token provides access to utilities, rewards, development funding, treasury reserve, voting, and staking benefits.
Note: DYOR Before Investing.
Do you Own Research before investing in any Coins or Tokens.

MOVR/USDT -70% Retracement Need for Future Growth$MOVR Impressive Rally: From $4 to $11 in a Flash!
In the world of #cryptocurrency the price movements of tokens can sometimes be as thrilling as a rollercoaster ride.
In this post, we'll discuss the recent journey of #MOVR and its potential future trajectory.
From Nov 2021 to Oct 2023, MOVR experienced a steep decline of 99.35%, dropping from a peak price of $540 to a low of $3.60.
However, the token made a stunning comeback from Oct 2023 to Dec 2023, surging by an astonishing 1132% (11x) and reaching a new high of $44 form $3.60 Bottom.
As we look to the future, there is a possibility that MOVR perience a retracement to the $10-$12 range before the next leg upward.
Waiting for a good entry at a dip can often lead to more favorable returns.

ROSE/USDT Potential $1 in Next bull runBCBA:ROSE Potential $0.5 & $1 in Bull Run
Best Accumulation zone: $0.08-$0.110
Targets: $0.22/$0.3/$0.41/$0.52/$1
Wait for good Entry and Accumulate at every big dip.
#ROSE #Cryptocurrency

FET/USDT Bullish Breakout so Target 50% ?FET/USDT 4H Chart Analysis:
FET has successfully broken a crucial resistance level, signaling a bullish trend.
Trade Strategy:
Target: Aiming for a 50% gain.
Condition: If #FET maintains above the $0.56 support level.
Keep a vigilant eye on the $0.56 support level, especially if you are in long positions.
#Crypto #Binance #Altseason

CRYPTO HIGH PROBABILTY SETUP FOR BIGGER GAINS (CHAINLINK USDT)Crypto is the most thrilling thing that one can trade as the price moments are very volatile like supercars speed on the highway. Due to these volatile price moments and the fact that the market remains open 24 x 7. It gives big returns within less period of time and also when it falls it falls badly. So trading it one can make a fortune out of it and also one can lose his entire capital within seconds.
So it's very important to have a good probability setup based on PRICE ACTIONS as it works almost everywhere in the world and also you need to have to make a trading plan in such a way that it eliminates emotion out of trading as we all know in trading SKILL are just 10% and execution and risk management is also just 10% rest 80% is emotion and psychology.
So the best way to eliminate emotions is to keep a stop loss such that even if it hits 10 times in a row you are not affected by it and when you make money you make a good chunk of money in one trade. That can be done by taking trade-in important areas where there is LIQUIDITY and BIG MONEY is also present to entre in the trade.
So here I am sharing analysis of CHAIN/USDT where the plan is to take the trade-in such an area where above liquidy is there and once taken out gives a very big move within no time and if fails also there is a short-selling idea that one can execute to catch the downside also in case of surprise events or shakeouts.
Trade Analysis I have explained on charts.
Hope you enjoy and learn something from it👍
- Pranesh Sahoo


Crypto Market Cap Expected To Rally Towards $400 Billion AreaCrypto Market Cap Expected To Rally Towards The $400 Billion Area
