UNISWAP dump 20% within 24 hours but Why ?⚡️ Breaking News: SEC vs. Uniswap
What's Happening?
In a major escalation by the #SEC and White House, Uniswap, faces legal challenges. Instead of recognizing haydenzadams as a pivotal entrepreneur, they're taking him to court.
Why It Matters: This isn't just a problem for Uniswap. It's like the government starting a fight with the whole Crypto
Prices Falling Fast:
UNI's Big Drop: The price fell 20% from $11.11 to $9 within 24 hour after Uniswap got a warning from the SEC.
More Bad News: Because of this warning, Uniswap's token price went down 20%. It looks like they might get sued.
Everyone, Pay Attention!
Stay updated and stand up for crypto
#Uniswap #UNI CRYPTOCAP:UNI
Search in ideas for "CRYPTO"

BITCOIN BEARISH DUMP ALERT #BITCOIN BEARISH DUMP ALERT
1⃣ CRYPTOCAP:BTC Trying to Break Strong Support $61600
2⃣ If $61600 Level Break then Ready for $50700 & $40500
3⃣ Below Red RedLine #BTC is Bearish
4⃣ Keep an Eye on Red Circle is a Critical Zone
5⃣ Overall BTCUSDT Current Trend is Bearish

BITCOIN Rising Wedge Bearish AlertBreaking: #BITCOIN Broken Rising Wedge Support
1⃣ CRYPTOCAP:BTC Broken Rising Wedge Support $70600
2⃣ Bearish Scenario if not Break $73500 Resistance
3⃣ Retest = $72500 And Target = $52500
4⃣ Trade with Confirmations and Never Trade Blindly and High Leverage

DOGE/USDT now 200% Up from our Entry setupCRYPTOCAP:DOGE Pattern Repeated and Blasting as per Our Analysis
1⃣ #DOGECOIN is now 200% Up from our Entry zone
2⃣ My Long Term Target is $2/$3/$4/$5
3⃣ Currently #Memecoins Session is on Fire
4⃣ Our Initial Entry was $0.65-$0.75 ✅
5⃣ ElonMusk Always Supports DOGE as per His Tweets
6⃣ Currently Strong Support at $0.1
RT/Comments if you Agree with My #DOGE Setup.

PolkaDot $50 Potential as per Chart After BreakoutI am Trying to buy CRYPTOCAP:DOT at every big dip.
Accumulation Zone: $4.50-$5.50
Targets: $20/$30/$50/$70
Polkadot is $50 Potential in Bull Run.
#NFA

Will Solana Hit $500 in Bull MarketAS per chart I am Bullish on SOLANA.
Before Big relly we can see retracement till $40-$50
Which will be good entry zone for long term.
I am Expecting CRYPTOCAP:SOL will hit $500 in bull market.

Dogecoin $5 Potential in Memecoin Season in Bull MarketCRYPTOCAP:DOGE Pattern is Repeating before Blasting We are waiting for a Perfect Retest.
The #DOGECOIN pattern is repeating, signaling a massive blast-off just around the corner.
A perfect retest is approaching, creating an incredible entry setup.
Once the retest is complete, watch Dogecoin soar to the moon!
In the #memecoins season of the bull market, $5 is a realistic target.
Get ready to ride the wave!
Share/Comments if you Agree with My #DOGE Setup.

Bitcoin Post Halving Target $200k as Per Chart Analysis#BITCOIN Post Halving Target $200k ( CRYPTOCAP:BTC )
1️⃣ 2016 Pre-Halving Pump +370%
2️⃣ 2016 Halving Dump -41%
3️⃣ 2016 Post Halving Pump +4100%
1️⃣ 2020 Pre-Halving Pump +335%
2️⃣ 2020 Halving Dump -63%
3️⃣ 2020 Post Halving Pump +1650%
1️⃣ 2024 Pre-Halving Pump +200%
2️⃣ 2024 Halving Dump -45%
3️⃣ 2024 Post Halving Pump +700%
For educational purposes only, No buying and selling Recommendations.
Hit a Like & Share your views

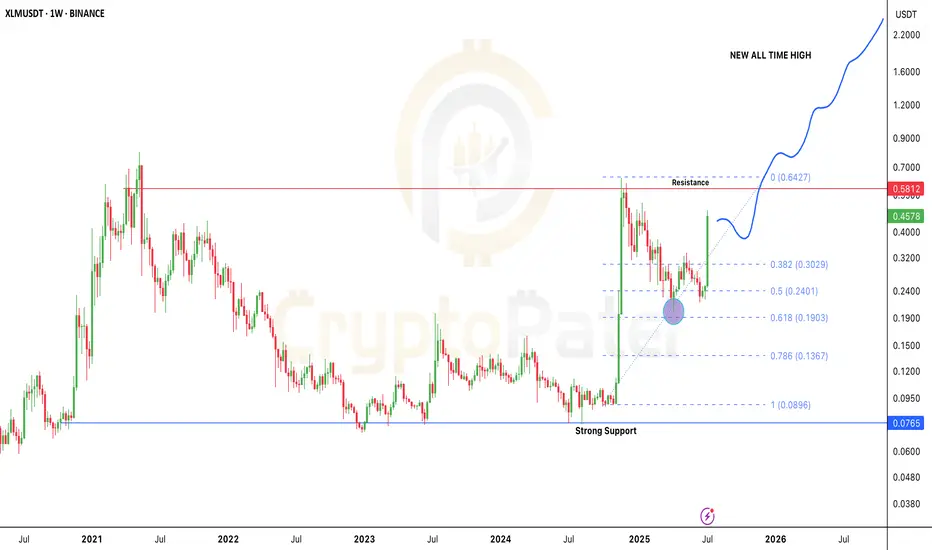
Stellar Breakout: Is $XLM the Next 10x Altcoin of 2025?After months of sideways action and accumulation, Stellar is finally showing real strength.
In the last 4 weeks alone, CRYPTOCAP:XLM has pumped over 120%, bouncing perfectly from the key 0.618 Fibonacci level near $0.19 — a classic reversal zone.
Here’s what’s really going on 👇
🔹 Back in Nov 2024, CRYPTOCAP:XLM went from $0.09 to $0.6374 in just 30 days — that’s a 600% move!
🔹 After that huge rally, price corrected nearly -68%, landing right at the golden Fib zone.
🔹 And guess what? Buyers stepped in hard, flipping the trend back to bullish.
Could we see a pullback?
Sure — maybe a small dip toward $0.30 (0.382 Fib). That’s normal. But the overall structure looks super bullish right now.
Major Resistance: $0.58
If that breaks and flips into support — we’re likely headed toward $2–$5 in the next wave.
This is one of the cleanest macro charts in the altcoin market right now.
👇 Drop your XLM target for this bull run in the comments!
Let’s see who’s aiming for the moon.
Note: DYOR & NFA
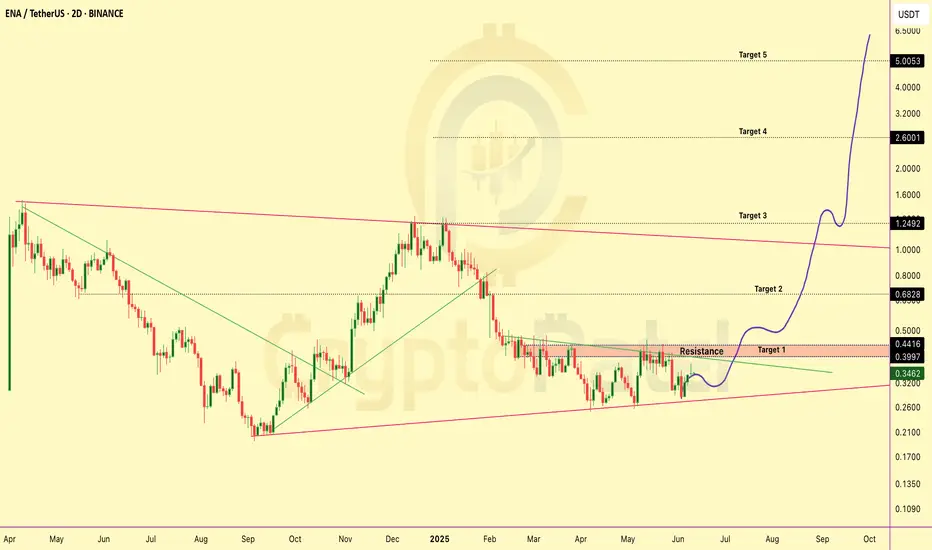
ENA/USDT Chart Analysis — Is It the Right Time To Accumulate?ENA/USDT Chart Analysis — Is It the Right Time To Accumulate?
MIL:ENA is still trading nearly -77% below its all-time high (ATH) of $1.52, currently hovering around $0.34.
Right now, the price is sitting above a strong support zone near $0.27, making the current range of $0.34–$0.30 an attractive accumulation zone — especially for long-term investors.
Short & Long-Term Targets:
Short-Term Targets: $0.44 → $0.68 → $1.25
Long-Term Potential: $2.60 → $5+
Key Levels To Watch:
Major Resistance: $0.45 — a breakout above this level could pave the way toward the $1 zone.
Strong Support: $0.27 — holding this level is critical to maintain bullish momentum.
Risk Note: As always, this is the crypto market — highly volatile and inherently risky. Please do your own research and manage risk wisely. This is NOT financial advice.
👉 Will ENA deliver another big leg up? Let us know your thoughts!
Note: NFA & DYOR
$RENDER Could Be the Next Nvidia of CryptoCRYPTOCAP:RENDER Could Be the Next Nvidia of Crypto
CRYPTOCAP:RENDER is one of the strongest AI projects in crypto right now — and it’s only getting started. The dip you see now?
That’s an accumulation opportunity for long-term believers!
▶️ Best Buy Zone: $4 – $3.40
▶️ Targets: $8.6 / $15 / $25 / $40 / $50
▶️ Strong Support: $2.90 – $2.50
As long as we’re above that — we’re super bullish! ✅
Why CRYPTOCAP:RENDER Can Hit $30–$50 This Cycle:
✅ Solves real problems – powers AI, 3D, VFX, gaming
✅ Trusted by giants – Netflix, Disney, Apple, Unreal Engine
✅ Limited supply + burn = strong tokenomics
✅ On Solana now – faster, cheaper, better
✅ Rides the AI wave – GPU demand is booming
✅ Last cycle = 49x. This time? Bigger stage, bigger vision.
It’s like the Nvidia of Web3 — but decentralized.
👇 If you believe in the future of AI + GPU power…
Keep your eyes on $RENDER. This one’s not just hype.
NFA & DYOR
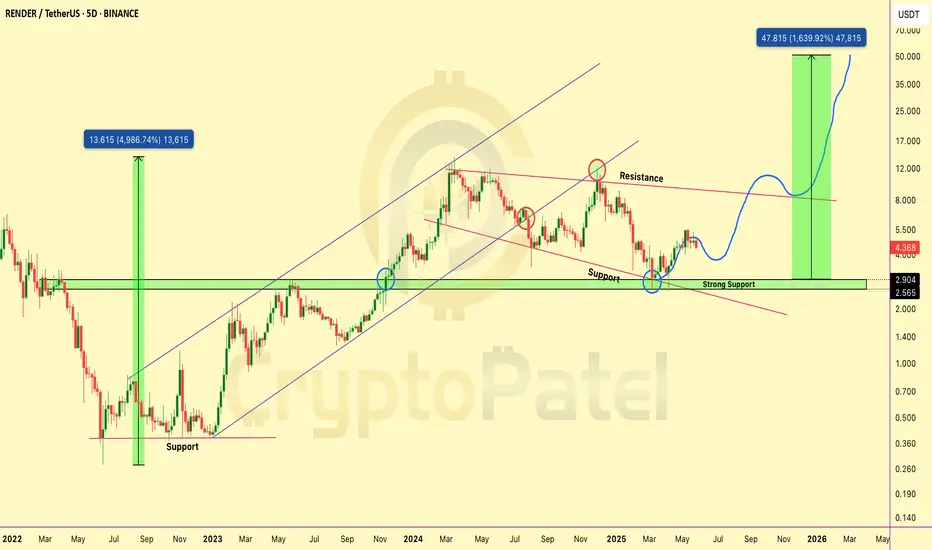
RENDER/USDT Bullish Chart Analysis#RENDER/USDT Chart Analysis
CRYPTOCAP:RENDER looks promising, with the next uptrend depending on the $4 support level. If $4 holds, we could see a target of $20!
However, if $4 breaks, expect a potential drop toward $1 support.
Key Levels:
Strong Supports: $4 / $1.50
Resistance: $6.50

SOLANA Bearish Analysis as per 4H chart Analysis#Solana is trading at a crucial resistance around $150, aligned with the 200 EMA. Below this level, SOL remains bearish. However, a breakout above the 200 EMA could signal an upward trend!
Stay vigilant!
#SOL #CryptoAnalysis #Trading

RSR/USDT 10x Potential in Bull MarketBear Market Survivor: How SEED_DONKEYDAN_MARKET_CAP:RSR Could Deliver 10-50X Returns
1⃣ -98% retracement from ATH
2⃣ Downtrend reversal
3⃣ Key accumulation zone with Retest
4⃣ Bull targets of 10-50x if support holds
5⃣ 70x Profit if Break ATH Price
NFA
#RSR #cryptotrading

Bitcoin Dominance Chart ( Altcoins Pump or Dump ? )Bitcoin Dominance Chart Analysis: Market Insights and Predictions
Bitcoin dominance, or BTC dominance, is a metric that measures the ratio of Bitcoin's market capitalization to the total market capitalization of all cryptocurrencies. This indicator is used to gauge the strength of Bitcoin relative to the broader crypto market. Currently, Bitcoin dominance stands at 51.30%.
Key Takeaways:
- Bitcoin dominance is trading at a higher resistance zone, which may lead to a retracement.
- A potential test of the 47.50% support level is possible before a leg up.
- The relationship between Bitcoin dominance and altcoins:
a. Increasing Bitcoin dominance: Altcoins may go down in value.
b. Decreasing Bitcoin dominance: Altcoins may experience a pump in value.
Support and Resistance Levels:
Support levels: 47.50% / 40%
Resistance levels: 53% / 70%
Analysis:
Bitcoin dominance is currently at a higher resistance zone, which could result in a retracement to the support level of 47.50%. This could potentially lead to a short-term pump in altcoins' value, as Bitcoin dominance decreases.

ICX/USDT Bullish Bounce and Expecting 30% Profit from HereICX/USDT Scalp Analysis:
Price Update: Strong Bounce from Support Level $0.24
Hey traders!
ICX/USDT has shown resilience with a strong bounce back from the support level at $0.24.
I'm looking to add some long positions around this support, anticipating a potential 10%-20% target gain.
Target Range: 10%-20%
Timeframe: 2-15 Days
Stop Loss: 4H Candle Close Below $0.24 Support Level
Let's ride the waves together!
Happy trading!
#ICX #USDT #CryptoTrading #BounceBack

CREAM/USDT Chart Anlysis#CREAM/USDT Chart Analysis
- Current Price: $17.50
- Holding strong at $17.40 support - expecting a bounce!
- Target: $24 post breakout at $18.50 level.
- Stop Loss: Any 4H candle close below $17.
#crypto #CREAM #Shib

TOTAL CRYPTO MARKET FORMED DOUBLE TOPTOTAL have chance to take retracement becoz of Double top and RSI DIVERGENCE, Next support levels are 1.2T , 980B , 874B and 725B. Another chance to make triple top also if interest rates go lesser.
#Bitcoin #nft #bnb #eth #btc #BSC #Binance #trading #altcoins #cryptocurrency #crypto

Crypto Price Prediction – BNB Coin Price Technical AnalysisBNB coin priced at $243. From technical analysis perspective, Binance coin BNB price chart today presently experiencing downtrend on the daily timeframe. The price resides below the 50 and 20 weekly EMA indicating bearish sentiment. Crypto price prediction technical analysis on daily timeframe.
To comprehend the existing level of support and resistance for binance coin BNB, we must examine the historical price data. Analyzing BNB coin price daily chart reveals trading range of $242 to $261 over the recent days.
Binance coin BNB crucial support level lies at $234 significantly impacting the cryptocurrency. A dip below this level could potentially lead to further price decline, with the subsequent support level positioned at $219.
BNB token price current resistance level resides at $266. A successful breakthrough beyond this level may initiate bullish trend with the subsequent resistance level set at $286 and $301.
Disclaimer: This technical analysis article is for informational purposes only and does not constitute financial, legal or investment advice. Please do your own research before making any decisions.

Cryptocurrency Ethereum / Bitcoin = BUYThe best entry point to BUY = LONG-TERM
Hello!
Those who want to buy Ethereum for Bitcoin, better wait for the best entry point!
Below are all my exhibits >>>
There are signals that are relevant to this day!
So enjoy your viewing:
Particularly interesting is the fact that by the end of May 2018, Bitcoin will fall to $ 3000.
But before that, of course it goes for about $ 22,000
Here is the last signal for Bitcoin:
BTCUSD, D
LONG
Cryptocurrency Bitcoin / Dollar = BUY
BTCUSD, D
LONG
Cryptocurrency Bitcoin / Dollar = BUY
BTCUSD , D
LONG
Cryptocurrency Bitcoin / Dollar = BUY
But the analysis and signal Bitcoin since January 4.
EURUSD, M
SHORT
Euro/ Dollar = ( Futures 6E) = Sell
The euro came to the targets for sale
ZECUSD , 240
LONG
Cryptocurrency Zcash / Dollar = BUY
STRATBTC , D
LONG
Cryptocurrency Stratis / Bitcoin = BUY
While also going right
NEOUSD, 240
LONG
Cryptocurrency NEO / Dollar = BUY
DOGEBTC, D
LONG
Cryptocurrency Dogecoin / Bitcoin -5.88% = BUY
AMGN , D
SHORT
Stock AMGN Amgen Inc = Short Positions
Sales are canceled, I will try to go out on my 185 - 186 there where I sold it.
BCYBTC , 240
LONG
Cryptocurrency BitCrystals
For the present I hold.
BCHUSD , D
LONG
Cryptocurrency Bitcoin Cash / Dollar = BUY
IOTUSD , D
LONG
Cryptocurrency Iota / Dollar = BUY
XRPUSDT , D
LONG
Cryptocurrency Ripple / Tether Dollar = BUY
DASHUSD, D
LONG
Cryptocurrency DASH / Dollar = BUY
T, W
SHORT
Stock T AT&T Inc = Short Positions
I'm sitting in position, Longevity!
XEMUSD, D
LONG
CryptoCurrency Nem / Dollar = BUY
XEMBTC D
LONG
Crypto currency NEM / Bitcoin = BUY

Cryptocurrency Bitcoin / Dollar = BUYThe best entry point to BUY = Medium term
Hello!!!
I expect a drop of about 7000 dollars for 1 Bitcoin. I can not say exactly when this will happen, maybe the price will fall right away, but maybe first it will reach $ 19,000 / In general, we look and wait, it's better to place limit orders or wait for the impulse to go down.
In addition, a little later, at the end of May 2018, Bitcoin could collapse to $ 3,000, there it is already necessary to buy for a long time
! And until then, at around $ 22,000, you have to take profit.
Many signals are still relevant!))
Every day I see that no Guru Trader can accurately determine where this entry point is to buy or sell)))) It is necessary for all Traders to show the entry point, rather than walking around and pointing out the approximate levels of the rebound .. ....)))
Everyone writes that if the p
Particularly interesting is the fact that by the end of May 2018, Bitcoin will fall to $ 3000.
But before that, of course it goes for about $ 22,000
Here is the last signal for Bitcoin:
BTCUSD, D
LONG
Cryptocurrency Bitcoin / Dollar = BUY
BTCUSD, D
LONG
Cryptocurrency Bitcoin / Dollar = BUY
BTCUSD , D
LONG
Cryptocurrency Bitcoin / Dollar = BUY
But the analysis and signal Bitcoin since January 4.
EURUSD, M
SHORT
Euro/ Dollar = ( Futures 6E) = Sell
The euro came to the targets for sale
ZECUSD , 240
LONG
Cryptocurrency Zcash / Dollar = BUY
STRATBTC , D
LONG
Cryptocurrency Stratis / Bitcoin = BUY
While also going right
NEOUSD, 240
LONG
Cryptocurrency NEO / Dollar = BUY
DOGEBTC, D
LONG
Cryptocurrency Dogecoin / Bitcoin -5.88% = BUY
AMGN , D
SHORT
Stock AMGN Amgen Inc = Short Positions
Sales are canceled, I will try to go out on my 185 - 186 there where I sold it.
BCYBTC , 240
LONG
Cryptocurrency BitCrystals
For the present I hold.
BCHUSD , D
LONG
Cryptocurrency Bitcoin Cash / Dollar = BUY
IOTUSD , D
LONG
Cryptocurrency Iota / Dollar = BUY
XRPUSDT , D
LONG
Cryptocurrency Ripple / Tether Dollar = BUY
DASHUSD, D
LONG
Cryptocurrency DASH / Dollar = BUY
T, W
SHORT
Stock T AT&T Inc = Short Positions
I'm sitting in position, Longevity!
XEMUSD, D
LONG
CryptoCurrency Nem / Dollar = BUY
XEMBTC D
LONG
Crypto currency NEM / Bitcoin = BUY

PYTH/USDT 50% Potential after breakout SEED_DONKEYDAN_MARKET_CAP:PYTH Bullish Pennant Breakout Confirmed
1⃣ 4H Chart Formed Bullish Pennant
2⃣ Breakout + Retest = ✅
3⃣ Expecting 40%-5-% Target From Breakout Level
4⃣ Stop Loss will be at $0.87 Level
5⃣ Overall Trend is Bullish of #PYTH
#Crypto

CGPT/USDT Currently 200% up from our EntryCGPT/USDT 10x GEM Analysis:
#ChainGPT is currently trading at $0.37 and Broken the promising Bull Flag pattern.
Hope you enjoyed this GEM Call with a huge Return.
Entry Zone: $0.10 - $0.140 ✅
Dips present were strategic buying chances.
Profit: Almost 200%
My Target for the Bull run is =
TP1: $0.3✅
TP2: $0.5✅ ( ALmost hit $0.4 )
TP3: $1
TP4: $2
Long Term TPs: $3/$4
RT if you want more 10x-50x GEM in this Bull Run.
#CGPT #Cryptocurrency #GEM #BitcoinETF $CGPT
