$BCH hasn’t hit a new ATH since 2017: Dead or Utimate Sleeper?SET:BCH hasn’t hit a new ATH since 2017: Dead or the Utimate Sleeper?
SET:BCH ATH: $4,212 (Dec 2017)
CRYPTOCAP:BTC ATHs: $19,800 (Dec 2017), $69,000 (2021), $126,000 (2025)
Observation:
SET:BCH hasn’t touched a new ATH since 2017.
CRYPTOCAP:BTC surged 6x+ after 2017 ATH, but SET:BCH stalled.
Is SET:BCH dead ❓
Key TA Levels:
🔹 Strong accumulation zone: $465 – $375
🔹 Critical support: $375 (holding this is essential)
🔹 Potential upside: $2,000 – $4,000 if momentum returns
Eyes on these levels. SET:BCH could be a sleeper play if it reclaims support.
Pro Tip: Patience + volume confirmation = key before any breakout.
NFA & DYOR
Search in ideas for "CRYPTO"

ETH Could Skyrocket to $7.8K After FUSAKA Upgrade: History ShowsCRYPTOCAP:ETH Could Skyrocket to $7.8K After FUSAKA Upgrade – History Shows
The last Ethereum Pectra Upgrade on 7 May 2025 triggered a massive move:
✅ +55% in 35 days
✅ +168% in 109 days
What’s next?
The FUSAKA Upgrade is scheduled for 3 December 2025. If history repeats:
👉 Target 35 days post-upgrade: $4,500 (7 Jan 2026)
👉 Target 109 days post-upgrade: $7,800 (22 Mar 2026)
Note: This is Purely Fractal Analysis Based on Pectra. Always DYOR – Markets can behave differently, and “Sell the News” Scenarios Happen.
Get ready for a potential ETHEREUM rally!
NFA & DYOR

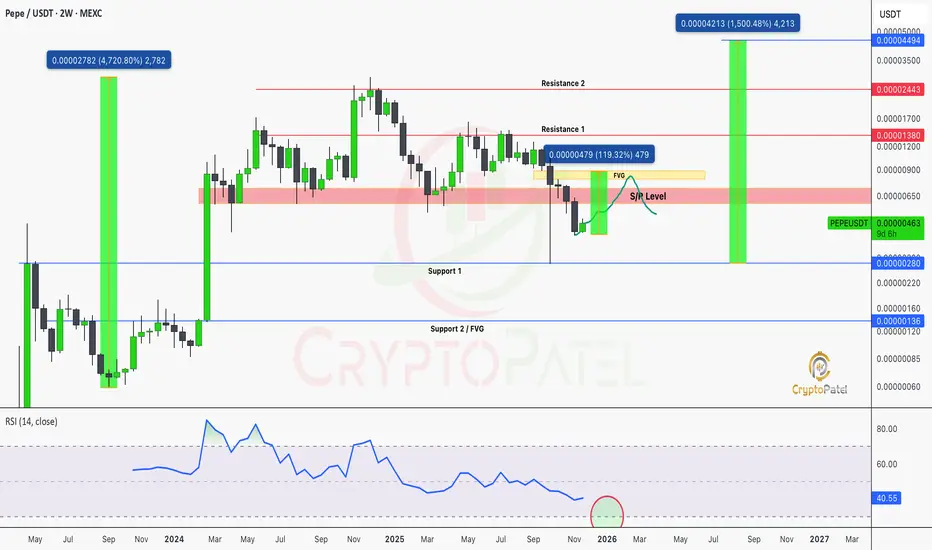
$PEPE Weekly Support Broken Or the Perfect Trap Before a Pump?CRYPTOCAP:PEPE Weekly Support Broken Or the Perfect Trap Before a Pump?
CRYPTOCAP:PEPE lost its weekly support and is now trading below it, which looks more like a full liquidity sweep than a real trend shift. I’m expecting a 50–100% relief rally before the next major move.
If key S/R flips and holds, we could see another memecoin cycle, with 1,000–1,500% upside back on the table.
Support / Accumulation: $0.00000280 / $0.00000136
Resistance / Targets: $0.00000914 → $0.00001380 → $0.00002443 → $0.00004494
Watch my levels closely before entering any trades.
NFA & DYOR
ETHEREUM ANALYSIS UPDATE:ETHEREUM ANALYSIS UPDATE:
Exactly as projected, CRYPTOCAP:ETH bounced perfectly from the 0.5 FIB retracement at $2,622.
That level has now transformed into a strong structural support, increasing the probability of an upside continuation and a potential run toward a new All-Time High.
But remember 👇
If Ethereum breaks below $2,622 (0.5 FIB), the market will likely hunt liquidity into the 0.618 Golden Zone or the Bullish Order Block before launching toward the $10K macro target.
Big dips = Big accumulation discounts. Stay strategic, not emotional.
1️⃣ $2,622 (0.5) – First Defense ✅
2️⃣ $2,256 (0.618) – Golden Zone
3️⃣ $1,821 (0.786) – Nuclear Support
NFA & DYOR

Bitcoin Ready to hit New Low?BITCOIN QUICK UPDATE: LEVELS PLAYING OUT EXACTLY AS EXPECTED
As we mentioned earlier, the $88,600 FVG has now been fully filled, and CRYPTOCAP:BTC is currently trading below that zone.
Here’s what matters next:
🔹 If $85,000 holds as support → BTC likely pushes toward the next major Bearish Order Block at ~$93,000.
High probability this zone gets tapped.
🔹 If BTC fails to reclaim and break above $88,000 → expect a deeper leg down toward ~$75,000.
Stay sharp. NFA.

$BTC STANDING ON ITS LAST SUPPORT: READ THIS BEFORE YOUR TRADEBITCOIN TECH UPDATE — FRESH LEVELS, FRESH PAIN
CRYPTOCAP:BTC just dumped to $80,641, making a new low since 12 April 2025.
That’s almost -30% from my Short + Exit levels.
Those who Rode the Short, Enjoy the profits.
Those who avoided chasing above $120k, capital saved again.
Where We Stand Now
Bitcoin is sitting exactly on the 0.786 Fib ($83,300), the strongest bullish support left on the chart.
This level = Bulls’ last hope.
If daily candle doesn’t close below $83,300, then expect a relief rally into upside inefficiencies:
Upside Targets (If 0.786 Holds)
$88,600 → major unfilled FVG
$93,000 → bearish Order Block (high probability fill)
$98,000 → another upside FVG waiting to be delivered
Watch how price behaves at these levels — next macro move will be decided there.
If 0.786 Fib Breaks…
Be ready.
Next liquidity pools: $73,000 / $66,000
Both zones have massive bullish orderflow waiting.
If 0.786 support holds → BTC still has high probability to push for a new ATH.
Summary:
Trend still bearish, but BTC is now at a critical support.
Hold → relief rallies + possibly new ATH.
Break → $73k–$66k incoming.
Stay sharp. Watch the levels. Trade with intention.
NFA &" DYOR

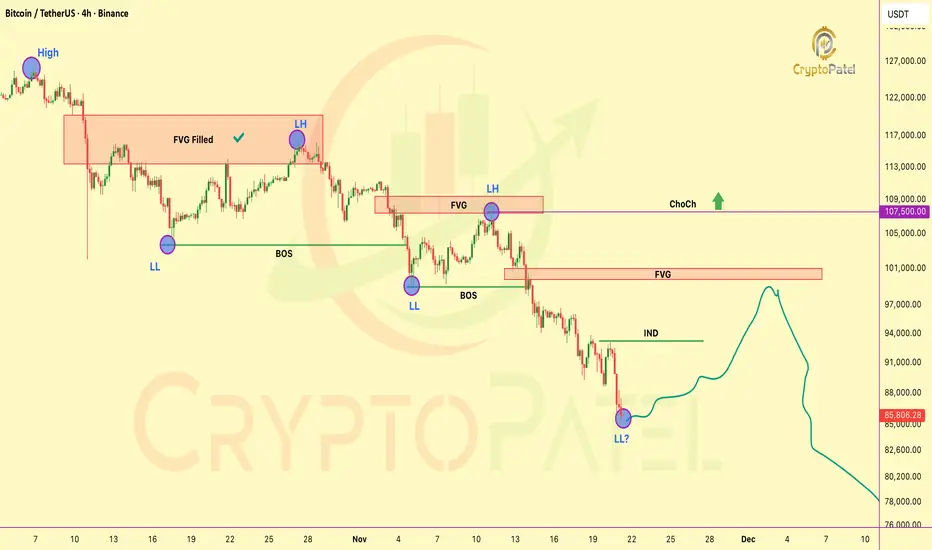
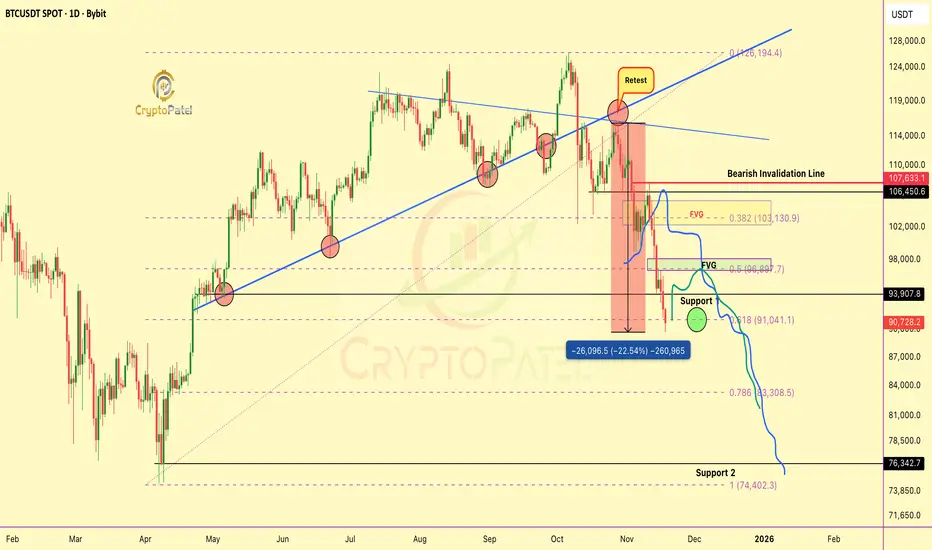
$BTC Just Printed Another LL: Next Draw Is Locked InCRYPTOCAP:BTC Just Printed Another LL: Next Draw Is Locked In
Market is maintaining a clear bearish orderflow with continuous LH → LL sequence.
Structural Notes
🔹 Previous major FVG (distribution zone) has been fully filled and delivered downside.
🔹 Multiple BOS events confirm continuation of the bearish leg.
🔹 Recent sweep followed by another LL shows sellers still in full control.
🔹 INDUCEMNET zone rests around $93160, high-probability inefficiency for short-term retracement.
🔹 Major unmitigated FVG remains at $100800, acting as a premium draw if price seeks liquidity.
Expectations
🔹 Retracement likely into nearby inefficiencies:
🔹 IND @ $93160 → high-probability mitigation
🔹 FVG @ $100800 → medium-probability mitigation (only if deeper pullback unfolds)
🔹 Trend remains bearish until market delivers a ChoCh above $107.5K.
Current Bias: Bearish
Short-Term Draw: IND (mid-range inefficiency)
Mid-Term Draw: Unmitigated FVG (premium zone)
Invalidation: ChoCh above $107.5K
NFA & DYOR
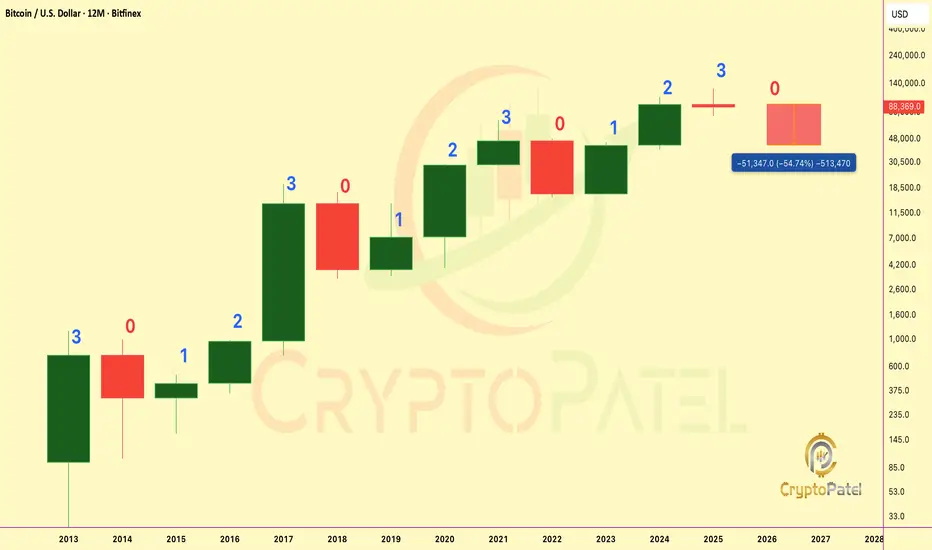
Bitcoin Most Critical 40 Days of the Entire Cycle🚨 Bitcoin Most Critical 40 Days of the Entire Cycle 🚨
CRYPTOCAP:BTC Yearly Fractal is clear: RED → 3 GREEN → BIG RED.
2025 = Candle 3, historically the strongest and always breaks ATH.
Bitcoin can hit a new ATH ONLY this year.
If BTC does not break ATH in the next 40 days, history shows it never breaks the 3rd candle high the following year: Meaning 2025 becomes the cycle top, and 2026 turns into a 50–70% retracement year ($30k–$40k).
✔ Break ATH → $150k–$180k
❌ No ATH → Biggest Correction of the Cycle in 2026
NFA & DYOR
$PEPE BREAKDOWN: 70% Dump? SMC Says YESCRYPTOCAP:PEPE BREAKDOWN (READ THIS BEFORE YOU SCROLL): 70% Dump? SMC Says YES
Price has broken the long-term support at $0.0000059 and that level is now strong resistance.
Until PEPE reclaims this zone, trend stays bearish.
SMC Structure
HTF Demand swept + Weekly FVG filled
Liquidity taken below multi-month lows
Support → Resistance flip at $0.0000059
Below this = continuation sell-side liquidity hunt
Downside Expectation
If price rejects from the new resistance, PEPE still has room for 60–70% downside.
That drop would hit the HTF Accumulation Zone → $0.00000178
(High-value area where Smart Money positions.)
Fractal Outlook
Last time PEPE entered this structure → 4650% bull run.
Same HTF pattern forming again.
If PEPE drops 40%–70%, that’s where long-term money accumulates for the next big move.
Reclaim $0.0000059 = bullish reversal
Stay below = deeper accumulation incoming
HTF structure is not bearish forever, It’s preparing the next expansion. Watch the reclaim.
NFA & DYOR

$ETH UPDATE – FVG FILLED & STRUCTURE CLEANEDCRYPTOCAP:ETH UPDATE – FVG FILLED & STRUCTURE CLEANED
CRYPTOCAP:ETH just bounced perfectly from the $2,880 FVG and the entire downside imbalance is now fully filled, meaning no remaining bearish FVGs below.
Structure is clean… Ethereum is now technically READY for upside continuation.
Only one concern:
👉 Bullish OB zones: $2,622 & $2,256
If we dip into these OB levels → that’s the BEST accumulation zone for a $10K–$15K ETH target in the next cycle.
Don’t miss any major dip on Ethereum imo.
Smart money accumulates when the chart is clean and now it is. 🚀
NFA & dYOR

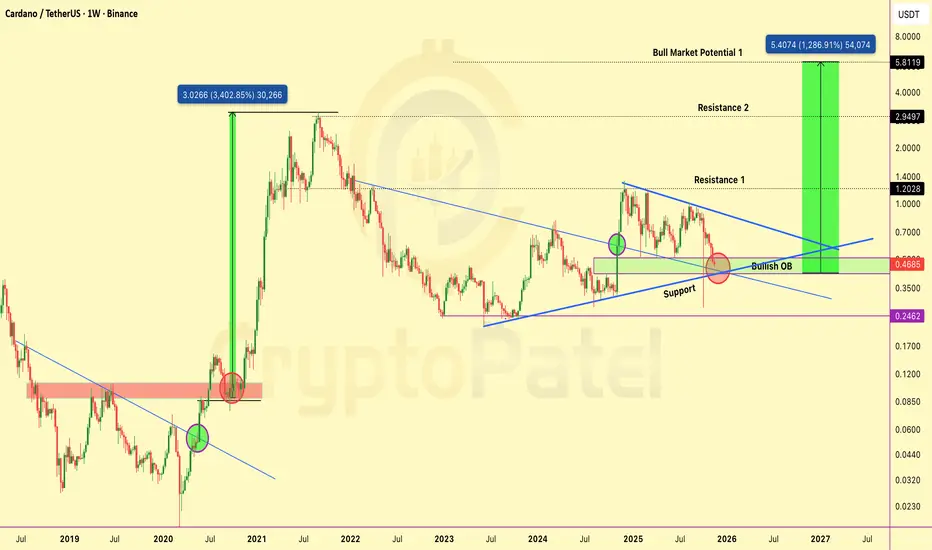
$ADA Retested THE Level That Triggered Its Last Parabolic RunCRYPTOCAP:ADA Just Retested THE Level That Triggered Its Last Parabolic Run: History About to Repeat?
Cardano is again retesting the same multi-year $0.46–$0.35 bullish order block inside the descending wedge that triggered its last explosive cycle. The structure is almost identical, only bigger.
Market Structure:
3+ years of compression tightening toward the apex
Price holding the institutional accumulation zone
Volatility squeeze signaling a high-probability breakout window
Upside Levels: $1.20 → $2.95 → $5.80+
Last time ADA broke this pattern, it didn’t move 30%… it moved 3,000%.
Asymmetric setup. Invalidation below $0.35.
Not financial advice. DYOR.
#BITCOIN UPDATE: Structure Still Playing Out Exactly as Mapped#BITCOIN Technical Update: Structure Still Playing Out Exactly as Mapped
CRYPTOCAP:BTC has now broken below the $90K zone, a level not seen since 22 April 2025, Seven months ago.
I told you this when Bitcoin was rejecting $115K, and we’re now ~22% down from that zone.
Price is following the structure with precision.
Key observations:
🔻 BTC currently sits on the 0.618 FIB: High-probability bounce zone.
A relief move into the $98K–$100K region is very possible in the coming days.
🔼 Upside FVG: ~$98,000
If price pushes deeper first, this FVG becomes the ideal tap before the next leg down.
This is why I said: don’t short here, Risk-reward is terrible at the lows.
A sweep toward $98K would offer a clean, low-risk short entry.
🔽 Downside FVG: ~$88,474: This zone can trigger a strong reaction and potential bounce.
Market structure remains intact:
Below $107.5K → macro bearish leg still active
Above $107.5K → invalidation + path toward new ATH reopens
Price continues to respect levels.
Charts > emotions. Structure > noise.
NFA & DYOR
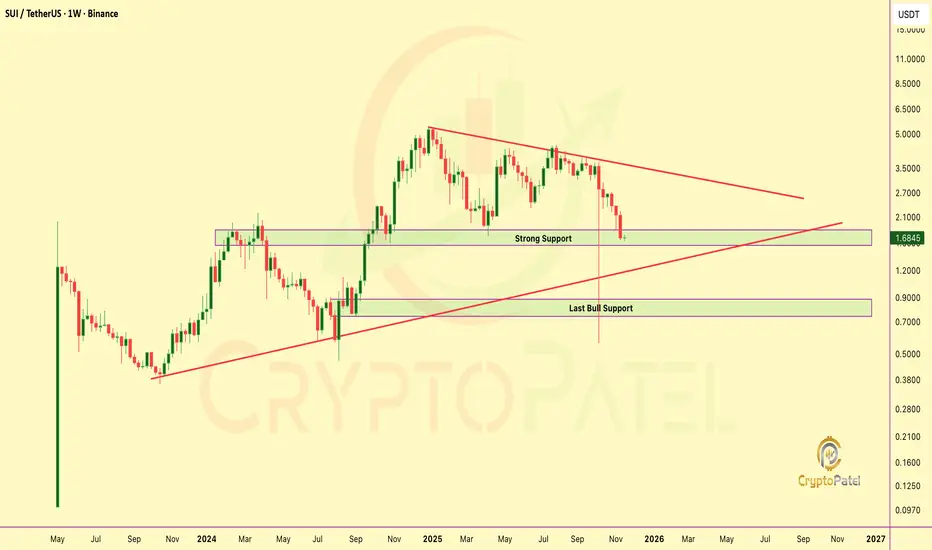
$SUI $1.66: The Liquidation Event That Just Printed the Next CycCRYPTOCAP:SUI Sharp ~70% Drawdown to the $1.66 zone has triggered broad Capitulation, with sentiment flipping decisively risk-off.
This is market structure: forced liquidity, weak-hand exits, and a reset in positioning after an overextended leg.
But historically, deep corrective sweeps often mark the final stage before trend re-acceleration. The $1.70–$1.00 range is emerging as a high-conviction accumulation pocket for investors with longer time horizons.
Should liquidity rotate back into high-beta assets later this cycle, a re-pricing toward the $10 region stays firmly on the Table.
In Crypto, Volatility Punishes Impatience and Rewards Discipline.
NFA & DYOR
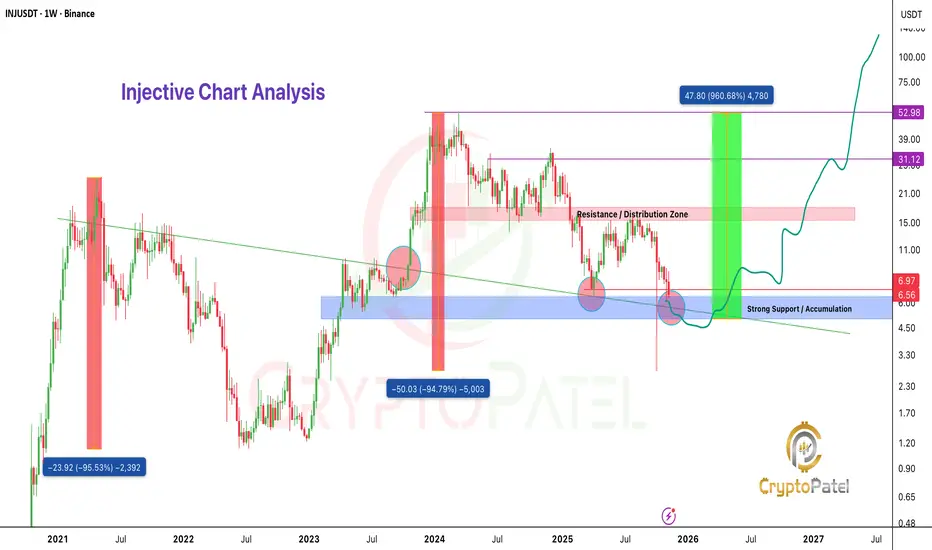
$INJ Is Repeating the 2021 Fractal: The Next 4,000% Move?CRYPTOCAP:INJ Is Repeating the 2021 Fractal: The Next 4,000% Move?
2021 Cycle Pattern:
🔹 Impulse: $0.65 → $25
🔹 Corrective Phase: -95% → $1.12
🔹 Expansion: +4,500% → $53 ATH
2024 Structure Mirrors 2021:
🔹 Impulse: $7 → $53
🔹 Corrective Phase: -94% → $2.74
🔹 Price now sitting inside historical Post-Cycle Reaccumulation Zone.
Accumulation Zone: $6–$4
Upside Targets: $15 / $30 / $50 / $70 (HTF liquidity clusters)
Invalidation: Break of structural low based on individual risk.
If 2021 fractal continues to play out, CRYPTOCAP:INJ is entering its highest-probability expansion window.
NFA & DYOR
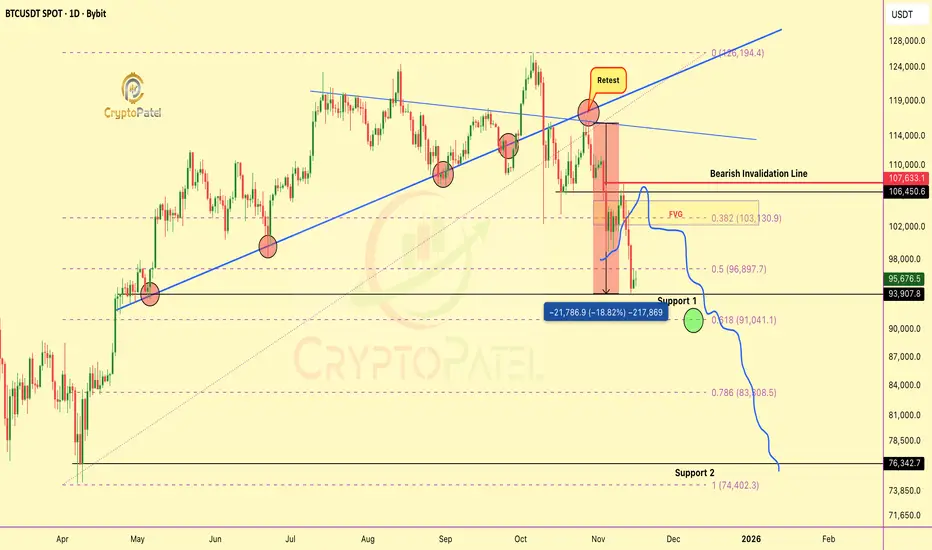
#BTC Technical Update: Structure Playing Out With Precision#BTC Technical Update: Structure Playing Out With Precision
CRYPTOCAP:BTC has tapped the $95K zone, completing the corrective leg projected when price was rejecting the $115K–$110K range.
Key downside levels already reached:
➡️ $105K ✔️
➡️ $93K ✔️
As long as price fails to break and close above $107,500, the bearish structure remains intact and the next liquidity target becomes: $73K
A confirmed close above $107.5K invalidates the bearish leg and reopens the path toward a new ATH.
Critical zones to watch:
➡️ 0.5 FIB — structural reaction level
➡️ 0.618 FIB — high-probability reversal pocket
🔻 Bearish below $107.5K
🔺 Bullish above $107.5K
Price is respecting structure with accuracy.
Charts > emotions. Levels > noise.
NFA & DYOR
#BITCOIN TECH UPDATE: BEARISH IN CONTROL#BITCOIN TECH UPDATE: BEARISH IN CONTROL
CRYPTOCAP:BTC is down 14% from $115K retest, clean rejection.
Trend remains bearish, structure forming lower highs & lower lows.
Key Zones:
Relief zone: $105K–$108K (short setup area).
Major support: $94K → break below = $76K next.
Momentum:
Selling pressure dominates; no bullish divergence yet.
Invalidation:
Only a close above $111.5K flips bias bullish toward $150K. ( Super Bullish Above $116.5K)
Plan:
Sell rallies. Manage risk. Avoid FOMO longs.
NFA & DYOR

BITCOIN TECH UPDATE: BEARISH DOMINATES MUST READ🚨 BTC TECH UPDATE: BEARISH DOMINATES MUST READ 🚨
CRYPTOCAP:BTC is down 14% from my bearish short at $115,000 retest.
✅ Those who shorted, well played.
✅ Those who avoided longing at the top, capital saved.
Price Action:
#BITCOIN hit 1st support and broke below, trend remains bearish.
Next target: $94,000.
Short-Term Relief:
Expect a bounce toward $105,000–$108,000 (retest + FVG zone) before the next leg down.
Longer-Term:
$94,000 key decision zone → potential drop to $76,000 if bearish momentum continues.
Will update with precision once $94k is reached.
Sentiment: Bearish as forecasted from $115k.
Bullish Trigger:
If BTC breaks $111,500 with HTF candle close, bullish scenario activates → potential ATH toward $150,000.
Trade smart. Watch levels. Manage risk.
Your move: Ride the bearish wave or wait for the relief rally?
NFA & DYOR

Bitcoin From $49k to $126k Target Achieved 📢 Hope you didn’t miss this…
On April 7, 2024, I posted my CRYPTOCAP:BTC chart calling for buys below $50K.
Bids filled perfectly at $49K, and price exploded to a new ATH at $126K.
That’s a +157% move, level-to-level, exactly as projected.
No hype: Just pure technical precision and liquidity flow mastery.

Bitcoin from $49k to $126k Target Achieved 📢 Hope you didn’t miss this…
On April 7, 2024, I posted my CRYPTOCAP:BTC chart calling for buys below $50K.
Bids filled perfectly at $49K, and price exploded to a new ATH at $126K.
That’s a +157% move, level-to-level, exactly as projected.
No hype: Just pure technical precision and liquidity flow mastery.

Will Bitcoin Ready to Next leg down toward $76000?CRYPTOCAP:BTC has completed a bearish retest at the $116K resistance zone, maintaining a bearish bias below $116K–$117K
If price continues to reject this level, I’m anticipating a corrective move toward: $105K → $93K → $76K
However, a confirmed breakout above $117K would invalidate the bearish structure and could trigger an extended rally toward $150K+.
Resistance: $116K–$117K
Support: $105K / $93K / $76K
Bias: Bearish below $116K | Bullish above $117K
Stay disciplined — structure > sentiment.
NFA & DYOR

$XRP ON THE EDGE OF SOMETHING BIGCRYPTOCAP:XRP ON THE EDGE OF SOMETHING BIG
XRP just broke out of a multi-year downtrend and is retesting major support at $2–$1.70.
Holding this zone keeps the bullish structure intact, a break above $3.30 could ignite a run toward $5 and even $10.
NFA & DYOR

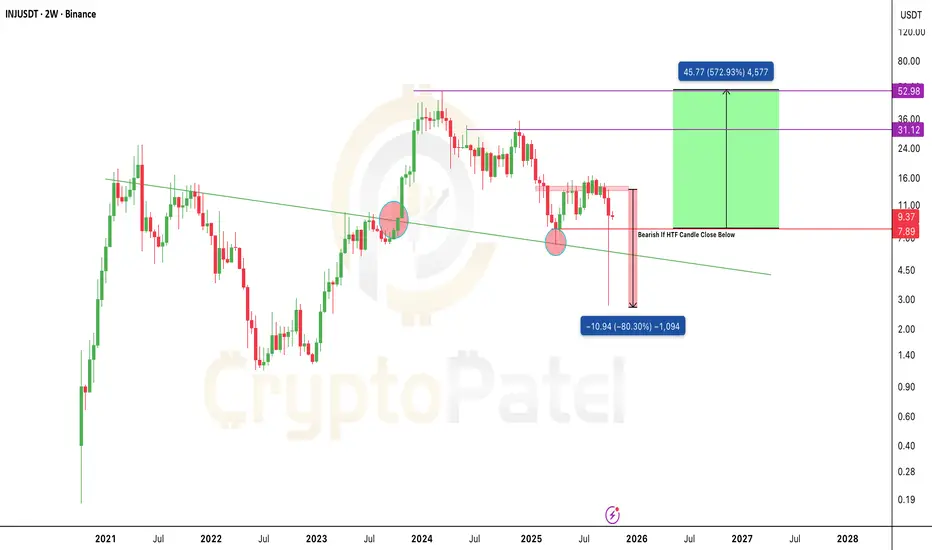
INJ/USDT Bullish Chart analysis and Potential $50 in future?CRYPTOCAP:INJ crashed nearly 80% after Trump’s 100% tariff announcement on China, few caught that insane dip below $3.
But here’s the thing, price is still holding strong above $7.8 support on HTF, meaning bulls aren’t done yet.
Accumulation Zone: $9–$7
Targets: $20 / $35 / $50
If CRYPTOCAP:INJ breaks out again, this could be one of the most explosive comebacks of the cycle.
NFA & DYOR
$BTC Technical Breakdown – As Predicted!CRYPTOCAP:BTC Technical Breakdown – As Predicted!
I already warned you at $110K to exit or short — and guess what?
We’re now up with 8% profit from that exact call!
#Bitcoin broke structure with a Bearish Divergence, and the trendline is looking weak.
If this war doesn’t stop, I expect further downside below $100K.
Key levels to watch:
🔻 Support 1: $73,500
🔻 Support 2: $48,700
If $100K breaks, don’t be surprised to see $90K → $80K → even $70K.
Don’t say I didn’t alert you.
I clearly told you to short or exit at the top.
Booked profits? Let me know below 👇
