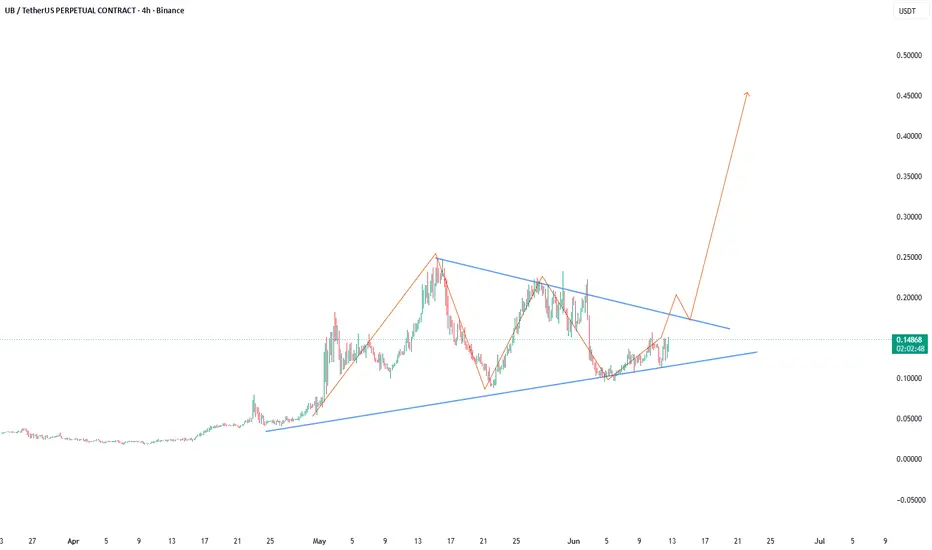
UBUSDT Setting Up For a Major Move?UBUSDT is currently trading inside a well-defined ascending triangle structure on the 4H timeframe. Price has respected the rising support trendline multiple times while the descending resistance line continues to compress volatility.
Key Technical Observations
• Higher lows continue to form, indicating sustained buyer interest.
• Price recently reacted strongly from the ascending support zone.
• The current structure resembles an accumulation phase rather than a distribution pattern.
• A brea
SEI
$SEI: Setup That Could Mint New Millionaires in 2026-2027 (100x?NYSE:SEI : Setup That Could Mint New Millionaires in 2026-2027 (100x Potential?)
#SEI is trading at the lower boundary of a macro descending parallel channel after an aggressive ~94% markdown from the $1.145+ ATH.
Technical Structure:
✅ Long-Term Descending Channel Controlling Price Since 2024 ATH
✅ Clear HTF Market Structure: Consistent LHs & LLs
✅ Major Support at $0.160 Broken → Flipped into Strong Resistance
✅ Support flipped to Resistance (classic S/R role reversal validated)
✅ Price Now
ETHEREUM ANALYSIS UPDATE:ETHEREUM ANALYSIS UPDATE:
Exactly as projected, CRYPTOCAP:ETH bounced perfectly from the 0.5 FIB retracement at $2,622.
That level has now transformed into a strong structural support, increasing the probability of an upside continuation and a potential run toward a new All-Time High.
But remember 👇
If Ethereum breaks below $2,622 (0.5 FIB), the market will likely hunt liquidity into the 0.618 Golden Zone or the Bullish Order Block before launching toward the $10K macro target.
Big dips = B
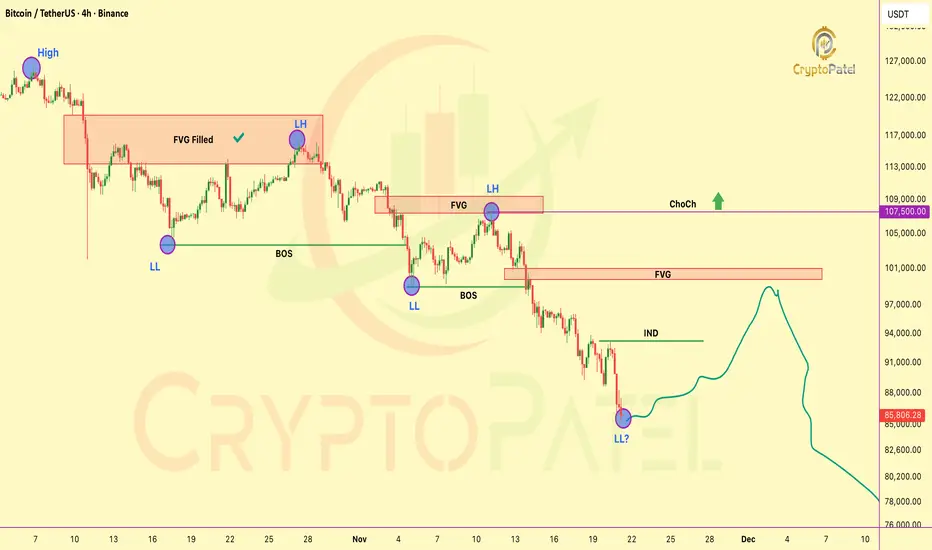
$BTC Just Printed Another LL: Next Draw Is Locked InCRYPTOCAP:BTC Just Printed Another LL: Next Draw Is Locked In
Market is maintaining a clear bearish orderflow with continuous LH → LL sequence.
Structural Notes
🔹 Previous major FVG (distribution zone) has been fully filled and delivered downside.
🔹 Multiple BOS events confirm continuation of the bearish leg.
🔹 Recent sweep followed by another LL shows sellers still in full control.
🔹 INDUCEMNET zone rests around $93160, high-probability inefficiency for short-term retracement.
🔹 Major u
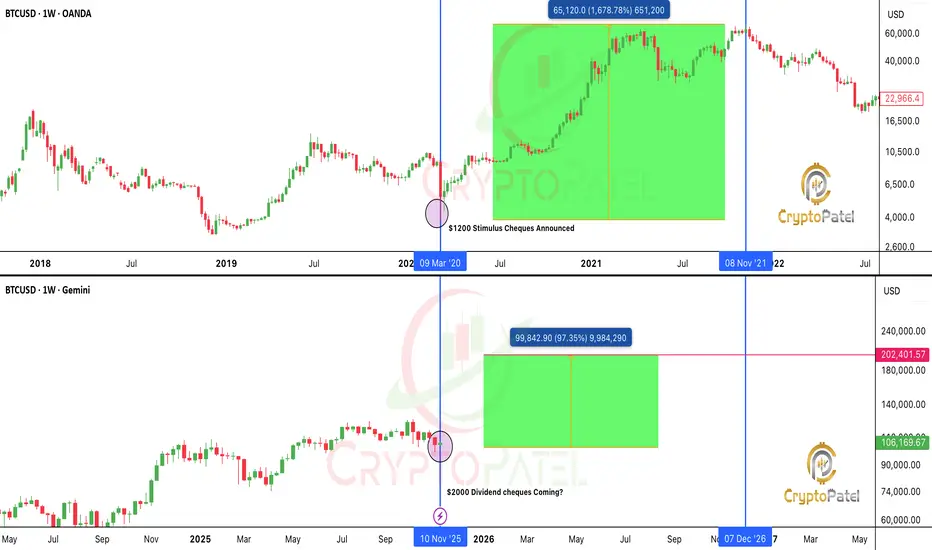
Trump’s $2,000 stimulus = $600B Liquidity: Bitcoin To the Moon?Trump’s $2,000 Stimulus Could Light the Fuse for the Biggest Crypto Rally Ever
This isn’t just another political headline.
If Trump’s plan to send $2,000 stimulus checks funded by tariff dividends actually happens, it could unleash a $600 billion liquidity wave into the economy.
That’s nearly the same scale as the 2020 stimulus, which kicked off one of the most legendary bull runs in history.
🔹 Bitcoin skyrocketed from $3,800 to $69,000
🔹 Ethereum exploded from $90 to $4,800
🔹 Altcoins went a
Will Bitcoin Ready to Next leg down toward $76000?CRYPTOCAP:BTC has completed a bearish retest at the $116K resistance zone, maintaining a bearish bias below $116K–$117K
If price continues to reject this level, I’m anticipating a corrective move toward: $105K → $93K → $76K
However, a confirmed breakout above $117K would invalidate the bearish structure and could trigger an extended rally toward $150K+.
Resistance: $116K–$117K
Support: $105K / $93K / $76K
Bias: Bearish below $116K | Bullish above $117K
Stay disciplined — structure > sentime
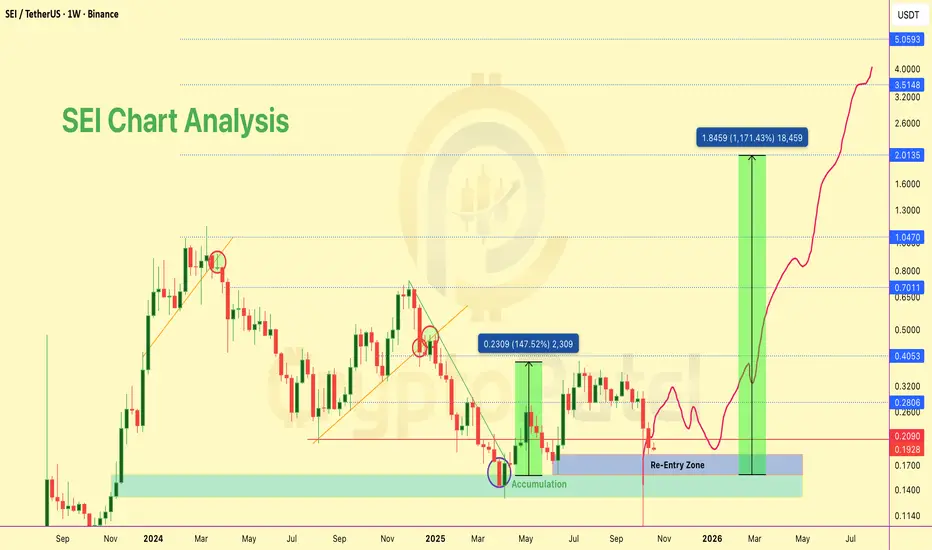
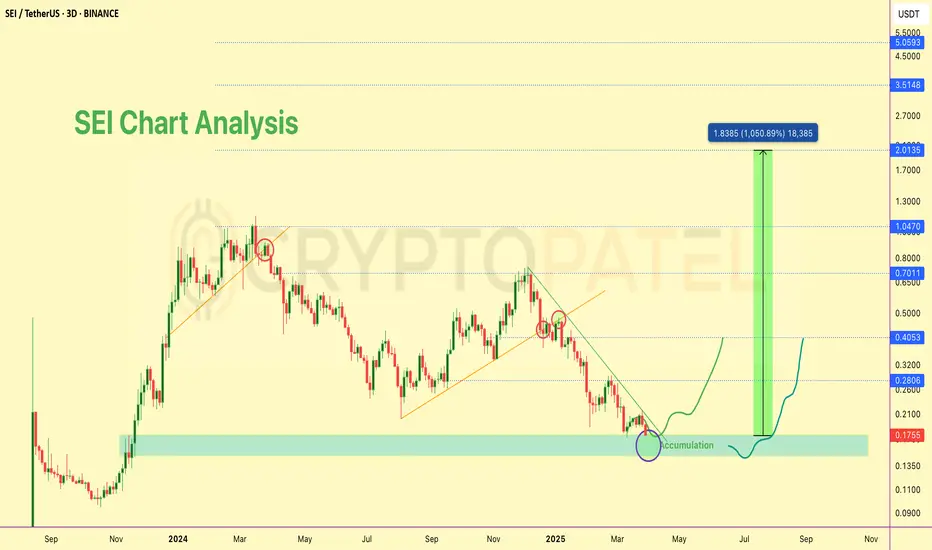
$SEI ACCUMULATION PATTERN FORMING🚨 NYSE:SEI ACCUMULATION PATTERN FORMING 🚨
If you missed the first run (+140%), here's your second chance.
We're back at re-entry levels after accumulation cycle.
RE-ACCUMULATION ZONE: $0.20 - $0.16
TARGETS: 5x-20x (realistic on strong fundamentals)
This isn't hype. Strong backing + proven accumulation pattern + solid technicals = institutional confidence.
History repeats. Are you taking it?
NFA & DYOR
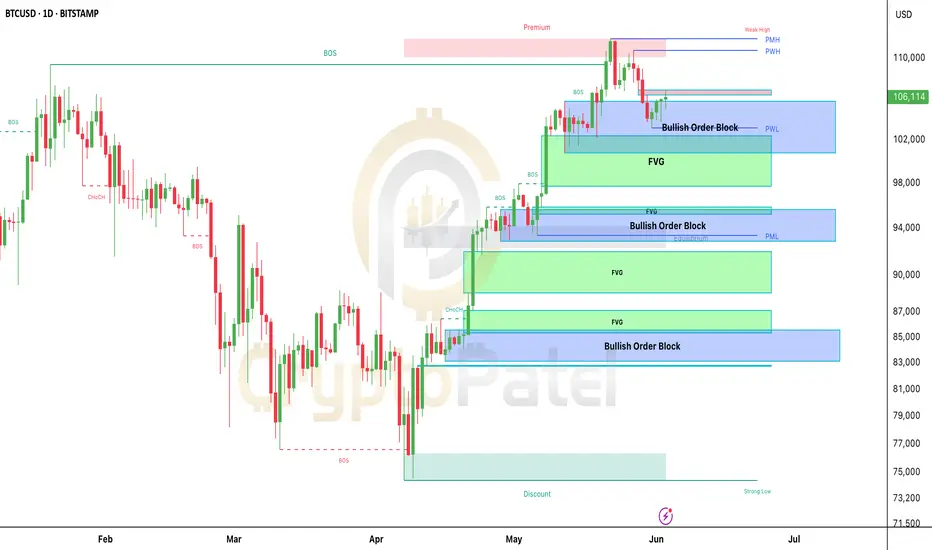
Bitcoin's Next Move: $110K Breakout or $94K Dip? SMC Decides#Bitcoin Daily Chart Analysis – Smart Money Update
As of today, BTC is trading around $105,800 and is showing signs of consolidation after reaching a key resistance zone near $110K.
Let’s break down what’s happening on the chart 👇
Current Market Structure
▶️ BTC has been in a clear uptrend, with multiple Breaks of Structure (BOS) confirming bullish momentum throughout April and May.
▶️ However, price recently entered a premium zone (above $110K), where it faced strong resistance.
▶️ This crea
$SEI to $2? Trump-backed + Institutional Buys = Next Altcoin NYSE:SEI to $2? Trump-backed + Institutional Buys = Next Altcoin Rocket!
#SEI already pumped +100% from our entry! Hope you enjoyed the ride.
But I’m still massively bullish on this setup.
▶️ Price is consolidating near strong support at $0.20–$0.14
▶️ This is a golden accumulation zone for the next leg up!
▶️ Backed by Trump’s Liberty Financial & multiple institutional buys
▶️ My targets for this bull run: $1 → $2 → $3 → $4
Still early. Still bullish. Still time.
Note: Not Financial Advice
Next 10x Gem?: SEI Bulls Eye $2+ After Key ChoCh at $0.22$SEI/USDT – Long-Term Technical Outlook
Price has likely established a local bottom near the $0.13–$0.15 demand zone, signaling potential for a macro accumulation phase.
🔸 Primary Accumulation Zone: $0.15–$0.13
🔸 Break of Structure Support: Below $0.13 opens downside to $0.10–$0.09 (secondary accumulation zone)
🔸 Bullish Market Structure Confirmation: HTF ChoCh above $0.22
🔸 Long-Term Expansion Targets: $2 and $5 (based on FVG extensions and historical impulse projections)
A successful retest
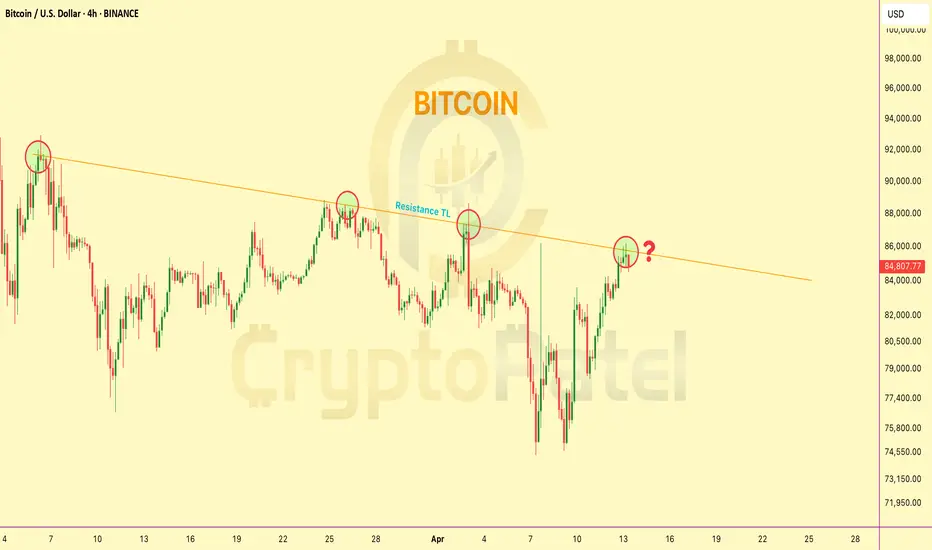
Bitcoin trading at Resistance level so What Next?🚨 Bitcoin 4H Chart Update
CRYPTOCAP:BTC is now trading right at the trendline resistance on the 4H chart
So what’s next?
1️⃣ Breakout and blast toward $100K?
2️⃣ Or another rejection down below $70K?
The decision point is HERE.
This breakout could change the game.
👇 Drop your thoughts –
$SEI/USDT- Long-Term Technical Setup and $5 Potential in BullRun📊 $SEI/USDT – Long-Term Technical Setup
NYSE:SEI is holding strong at the $0.18 support zone, showing early signs of accumulation. This level has historically acted as a demand area, making it a key zone to watch.
🔹 Structure: Forming higher lows – bullish trend intact
🔹 Volume: Accumulation pressure building
🔹 Sentiment: Backed by large-scale buyers (e.g., Trump’s World Liberty)
📈 Long-Term Targets:
➡️ $0.45 → $1.00 → $2 / $3 / $5 (macro targets similar to CRYPTOCAP:SUI )
🛑 Invalidation:
SEI TO MAKE 2X IN COMING DAYSThe CRYPTOCAP:ETH chart shows prices hovering around a key support zone of 1,750 - 1,830 within a descending channel. The red Ichimoku Cloud above acts as a strong resistance barrier, indicating potential challenges in breaking upwards.
If support holds, aim for a bounce towards the cloud resistance near 2,400. A successful breakout from the cloud could target 2,800 and beyond. However, if support fails, watch for a dip to 1,600 levels.
SEI/USDT 20x Potential from Accumulation ZoneNYSE:SEI Accumulation Zone – High Potential Trade
🔹 -76% from recent high, making it a prime accumulation zone.
🔹 My Accumulation Zone: $0.20 – $0.15
🔹 Upside Potential: Chart indicates an easy move to $0.50—if it breaks, expect a major rally!
🔹 Long-Term Targets: $1/$3/$5/$10
🔹 Catalyst Alert: Even #TRUMP is accumulating #SEI adding strong bullish momentum!
Strategy: Accumulate on dips, take profits strategically, and hold a portion for long-term gains.
#Altcoins #NFA
This $SEI setup could be the best entry of the bull run!This NYSE:SEI setup could be the best entry of the bull run! Don’t miss out!
The market dumped hard, but opportunity knocks.
#SEI pumped 118% from our entry before dumping! Now, I’m accumulating in the Daily Demand Zone.
▫️ Potential: 5x-10x
▫️ SL: Below $0.20 (Daily Demand Zone)
If $0.20 holds, this could be the best entry of the bull run! 🏆
#Altcoins
Is SEIUSDT Poised for a Breakout or a Trap?Yello Paradisers! Is SEIUSDT about to make a major move, or are we looking at a potential trap? 📉
💎We’ve spotted a descending channel on SEIUSDT, typically a bullish pattern—but let’s not get ahead of ourselves. To confirm this setup and stack the odds in our favor, we need to see a breakout and a candle close above the resistance zone. Without this, it's all just speculation.
💎If the price pulls back, we might witness a potential bounce and the formation of a double bottom pattern—another bul
SEI/USDT: Bullish Shark Pattern Signals Potential RallySEI/USDT has formed a bullish shark pattern and is showing a bullish divergence bounce, indicating strength.
There is now a chance to retest the $0.30 level, after which a rally is expected.
The targets are $0.58 and $1.16.
#SEI #USDT #CryptoTrading #BullishSharkPattern #BullishDivergence #CryptoAnalysis #TradingTargets #CryptoRally #TechnicalAnalysis
SEI is setting the stage for a potential bear trap! 🐻🚫💎 Paradisers, #SEI might trap bears who entered during the recent breakdown.
💎If #SEIUSDT breaks out from the recent cup and handle pattern, we can anticipate a bullish move. This scenario would likely trigger bear stop losses, potentially driving a bullish trend.
💎However, if the price breaks down below the minor support level, it would be considered a continuation of the short-term bearish trend, and we might expect further bearish movements. For now, though, I am not interested in focusing