SENSEX Weekly Expiry Outlook | Key Levels To Watch📊 **SENSEX 15-MINUTE OUTLOOK | KEY LEVELS TO WATCH**
The **SENSEX is trading around 74,318**, with the latest 15-minute candle showing selling pressure after rejection from the **74,400+ zone**.
The chart currently shows a clear battle between the **74,200 POC** and the nearby supply zone.
### 🔴 SUPPLY ZONE
**74,380 – 74,440**
A sustained move above this zone could indicate renewed buying momentum.
### ⚪ KEY POC
**74,212.85**
This is the immediate reference level.
📈 **Above POC:** buyer
Sensexprediction
SENSEX Monthly Expiry — The Battle Between 77,400 & 77,800📊 August Monthly Expiry | 27 Aug 2026
SENSEX is showing a cautious-to-bearish intraday structure, with price around 77,486 and trading below both the 9 EMA (77,574) and 14 EMA (77,596).
The key question for expiry day: Will bulls reclaim 77,600—or will bears break the 77,400 demand zone?
🟢 BULLISH SETUP
A sustained move above 77,600 could bring buyers back into control.
🎯 77,950
🎯 78,096
🎯 78,278
A decisive breakout above the 77,700–77,800 supply zone could trigger stronger momentum.
🔴 BE
SENSEX 15-Minute Setup | 20 August 2026 | Weekly ExpirySENSEX Intraday View
Price is trading near 77,407, with 77,471 as the immediate breakout level.
Above 77,471: momentum may target 77,617, 77,730, and 77,842.
Below 77,368: weakness may extend toward 77,236, 77,140, and 77,040.
Trading approach: Wait for a confirmed 15-minute close beyond the trigger level; avoid entries in the middle of the range.
Professional takeaway:
The chart presents a clear battle zone between 77,368 and 77,471. Let price prove direction—trade the breakout, respect th
SENSEX: Line of Control at 77,872SENSEX Trading View | 13 August 2026
The attached 15-minute chart shows SENSEX attempting a recovery after a sharp decline. Price is currently around 77,966, with 77,872 marked as the Line of Control.
📈 Bullish Scenario
A sustained move and 15-minute close above 77,900–77,950 could trigger a move toward:
🎯 78,154
🎯 78,321
🎯 78,543
The 77,900–78,000 area is the immediate supply zone, so a clean breakout with momentum is important.
📉 Bearish Scenario
If SENSEX fails to sustain above the Lin
SENSEX Outlook | Breakout / Rejection at the 50% Fibonacci LevelSENSEX Trading Plan | August 6, 2026
📊 Market Bias: Neutral to Bullish Above 78,642
The chart indicates a strong intraday recovery from the day's low, with buyers stepping in aggressively after a prolonged decline. Price is now approaching the 50% Fibonacci retracement (78,642), which is the key decision level for today's session.
🟢 Bullish Scenario
Buy Above: 78,642 (50% Fibonacci Level)
A sustained move above 78,642 would indicate that buyers have regained short-term control.
Upside Targ
Sensex Expiry | Price Analysis | Bulls Vs BearsHere's an analysis of the BSE SENSEX on the 15m timeframe
Bottom line
The 15m chart for SENSEX indicates a cautious-to-neutral bias, with the index trading below key moving averages and exhibiting a downtrend structure.
Structure & trend
The SENSEX is currently trading at 76,789.6, below both its 15m SMA20 (76,833.7) and SMA50 (77,175.8).
The price action shows a pattern of lower highs and lower lows, confirming a short-term downtrend.
Momentum, as indicated by the RSI14 at 43.7, is in
SENSEX | Weekly Expiry | 15 Min Chart AnalysisThe BSE SENSEX 15m chart indicates a cautious outlook, with price action suggesting a potential downtrend in the short term. The market is currently closed, so these observations are based on the last completed session (2026-07-15).
🟣 Bottom line
Cautious bias: Sensex is in a short-term downtrend, trading below key moving averages with neutral-negative momentum.
🟣 Structure & trend
* The price is currently below both the 15m SMA20 (76,833.7) and SMA50 (77,175.8), indicating a bearish short
Sensex Price Prediction | 15 Minutes Chart | Weekly Expiry** Sensex Chart is delayed on Trading View **
SENSEX (15-Minute) Technical Outlook | Relief Bounce or Trend Continuation?
After witnessing aggressive selling pressure, Sensex has entered a crucial support zone around 76,300, where buyers have shown an initial response. While the bounce is encouraging, the overall market structure continues to favor the bears until key resistance levels are reclaimed.
Technical Observations
Market structure remains bearish, with a clear pattern of lower high
SENSEX | Daily Analysis | Breakout or Rejection?SENSEX 15-Minute Outlook: Consolidation Near Resistance – Breakout or Rejection?
The SENSEX 15-minute chart is approaching a decisive inflection point after recovering from recent lows. Price has reclaimed short-term support but is now trading just below a well-defined resistance zone. This area will likely determine the next intraday directional move.
Technical View
The recent recovery has been constructive, but momentum is beginning to slow as buyers encounter supply near the 77,300–77,2
SENSEX Outlook | Institutional Price Action AnalysisThe S&P BSE Sensex continues to trade inside a crucial decision zone after a sharp rally followed by healthy profit booking. While the broader market structure remains constructive, price is now testing an area where both buyers and sellers are likely to become aggressive.
The current setup offers a high-probability opportunity—but only after confirmation. Patience remains the key.
🔍 Technical Overview
After posting a strong impulsive move from the recent swing low, Sensex faced rejection n
SENSEX Expiry Special Trading Plan: April 9, 2026The session on April 8, 2026, was a historic day for the Indian indices. Following the massive global sentiment shift and cooling energy prices, SENSEX mirrored the broader market’s exuberance, staging a vertical recovery that has completely shifted the technical landscape heading into the Thursday Expiry.
📊 Previous Day Outcome (8-Apr-2026)
Actual Market Move: Sensex witnessed a massive Gap Up of over 2,000 points, reclaiming the 77,000 mark with ease.
Movement: The index displayed "Trend Day
SENSEX : Trading plan for expiry 08-Jan-2026SENSEX Trading Plan for 8-Jan-2026
(Timeframe: 15-min | Gap criteria: 300+ points)
🔑 Key Levels to Track (from chart)
Major Upside Resistance: 85,632
Upper Resistance / Supply Zone: 85,174 – 85,295 (No-Trade Zone)
Immediate Pivot / CMP Zone: ~84,968
Opening Support: 84,772
Last Intraday Support Zone: 84,492 – 84,560
Lower Support Extension: 84,294
🧠 Market context: SENSEX is coming after a sharp corrective move and is currently trying to stabilize near lower supports. The 85,174–85,295 zone
SENSEX : Trading levels and Plan for 24-Dec-2025SENSEX Trading Plan for 24-Dec-2025
(Chart reference: 15-min | Gap criteria considered: 300+ points)
Key Levels to Track (from chart)
Major Upside Resistance: 86,241.83
Last Intraday Resistance: 85,996.00
Upper Range Resistance: 85,690.62
Opening Support / Resistance (Pivot): 85,453.00 – 85,499.60
Last Intraday Support: 85,131.00
Lower Support: 84,918.00
🟢 1. GAP-UP OPENING (300+ Points)
If SENSEX opens well above 85,690, price enters a strong supply zone immediately.
🎓 Educational
SENSEX : Trading levels and Plan for 11-Dec-2025📊 SENSEX TRADING PLAN — 11 DEC 2025
Sensex closed around 84,376, sitting just above the Opening Support Zone (84,337–84,400) and below the Opening Resistance (84,631).
Price is at a decision point — a breakout on either side will shape the day’s momentum.
Key Levels from Chart:
• Opening Support Zone: 84,337 – 84,400
• Last Intraday Support: 84,107
• Buyer’s Support Zone: 83,486 – 83,526
• Opening Resistance: 84,631
• Last Intraday Resistance: 84,792
• Major Resistance: 85,209
The opening s
SENSEX : Trading levels and Plan for 10-Dec-2025📊 SENSEX TRADING PLAN — 10 DEC 2025
Sensex closed near 84,687, positioned inside the No Trade Zone / Opening Support Zone (84,503–84,664).
A clean directional bias will develop only if price exits this zone either upward or downward.
Key Levels from the Chart:
• Opening Resistance (Gap-up case): 84,874
• Last Intraday Resistance Zone: 85,133 – 85,187
• Major Resistance / Target: 85,499
• Opening Support / No Trade Zone: 84,503 – 84,664
• Major Downside Support: 84,111
Tomorrow’s opening wil
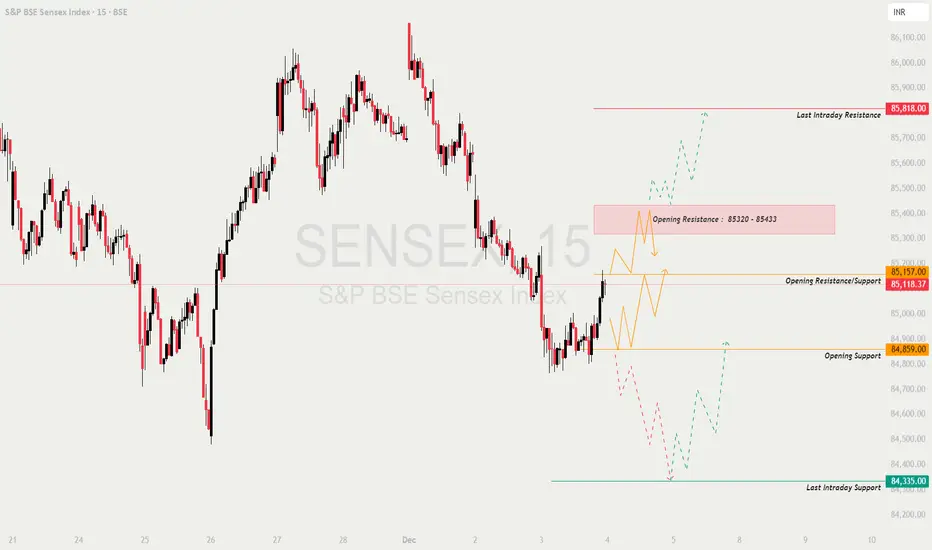
SENSEX : Trading levels and Plan for 04-Dec-2025📊 SENSEX TRADING PLAN — 04 DEC 2025
Price closed near 85,118, sitting just below key zones:
• Opening Resistance/Support: 85,157
• Opening Support: 84,859
• Opening Resistance Zone: 85,320–85,433
• Last Intraday Resistance: 85,818
• Last Intraday Support: 84,335
The market recently bounced from lows but still sits within a corrective structure. Tomorrow’s opening direction will decide whether SENSEX attempts to retest upper resistance zones or slides back toward the 84,335 support region.
🚀
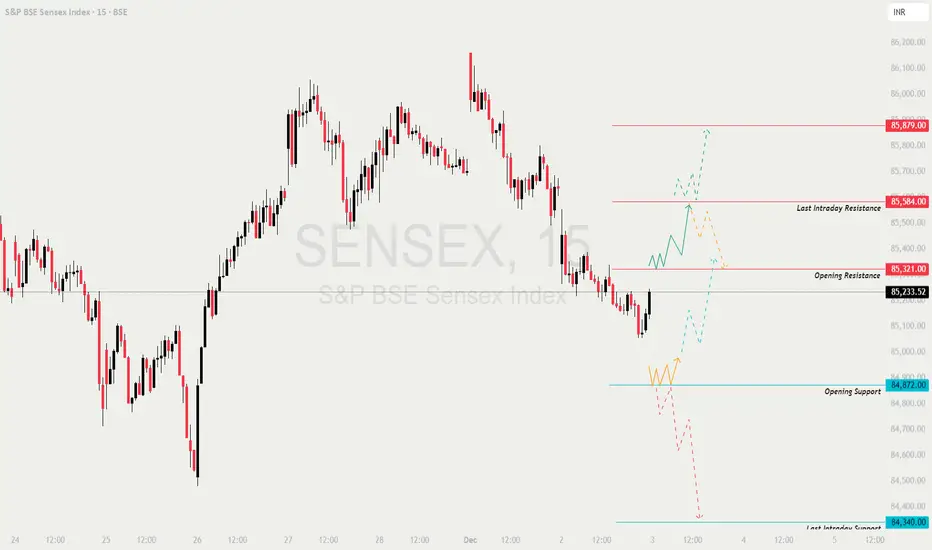
SENSEX : Trading levels and Plan for 03-Dec-2025📊 SENSEX TRADING PLAN — 03 DEC 2025
Sensex closed near 85,233, right below the Opening Resistance (85,321).
The structure shows a base at 84,872 and intraday resistance at 85,584, with clear upside and downside liquidity zones.
The opening trend will depend on how the index behaves around 85,321 and 84,872.
🔍 KEY MARKET LEVELS
🟥 Opening Resistance: 85,321
🟥 Last Intraday Resistance: 85,584
🟥 Major Bull Target: 85,879
🟩 Opening Support: 84,872
🟩 Last Intraday Support: 84,340
🟩 Major Bear T
SENSEX : Trading levels and Plan for 27-Nov-2025📊 SENSEX TRADING PLAN — 27 NOV 2025
Sensex closed near 85,598, sitting just below the No-Trade Zone (85,464–85,597) and heading toward a crucial resistance cluster at 85,999–86,143.
Market structure shows bullish momentum, but overhead supply requires caution around the opening.
Key Levels for the Day
🟨 No Trade Zone: 85,464 – 85,597
🟥 Last Intraday Resistance: 85,999 – 86,143
🟩 Last Intraday Support: 85,165 – 85,272
🟩 Major Downside Level: 84,775
🟢 SCENARIO 1 — GAP-UP OPENING (300+ Point
SENSEX : Trading levels and Plan for 20-Nov-2025Request you please hit LIKE or BOOST button - Like Target 25
📊 SENSEX TRADING PLAN — 20 NOV 2025
(Timeframe: 15-min | Reference: Key price reaction zones & intraday structure)
SENSEX closed around 85,176, sitting directly inside the No-Trade Zone (85,026 – 85,232) which indicates indecision and potential volatility at tomorrow’s open. Price is just below a strong resistance cluster at 85,577 – 85,612, and a major upside extension level at 85,999.
Key Zones to Track:
🟧 No-Trade Zone: 85,
SENSEX : Trading levels and plan for 18-Nov-2025📊 SENSEX TRADING PLAN — 18 NOV 2025
(Timeframe Reference: 15-Min Chart)
Chart Summary:
Sensex closed near 84,920 , maintaining its upward bias after recent strength, but now approaching multiple resistance levels that could trigger either continuation or profit booking.
Key resistance zones are seen around 85,081 (Opening Resistance – Gap-Up Case) and 85,437 (Last Intraday Resistance) . On the downside, key supports lie near 84,730 (Opening Resistance / Support) , 84,231 (Opening Supp
SENSEX : Trading levels and plan for 17-Nov-2025📊 SENSEX TRADING PLAN — 17 NOV 2025
(Timeframe Reference: 15-Min Chart)
Chart Summary:
Sensex closed around 84,654 , showing a recovery from the recent lows but still within a mixed-to-cautious phase. The price currently hovers near 84,730 (Opening Resistance / Support Zone) , suggesting a tight equilibrium between buyers and sellers.
Immediate resistance is placed at 85,081 (Gap-Up Opening Resistance) , followed by 85,437 (Last Intraday Resistance) . On the downside, supports lie near
SENSEX INDEX INTRADAY LEVELS ( EDUCATIONAL PURPOSE) 11/07/2025📉 Sensex Intraday Trade Plan – 11 July (Friday)
🕒 Chart: 5-min/15-min | Trading TF: 1-minute
🔽 Market Context:
Strong downward momentum from 83,800 zone
Lower highs forming; near 83,150 support
Today’s opening crucial — at support or breaking it
🔼 GAP-UP Opening (Above 83,200)
✅ BUY on breakout above 83,220 with volume
🎯 Target 1: 83,280
🎯 Target 2: 83,330
🛑 Stop Loss: 83,180
🔎 Confirmation: Bullish 1-min candle + Volume spike
🔽 GAP-DOWN Opening (Below 83,100)
✅ SELL below 83,080 on breakdown
#Sensex directions and levels for December 4th.
Current View:
The sentiment looks similar to that of Nifty. If the market takes an initial pullback, it could reach a minimum 81202 or 50%. After that, if it gets rejected there, we could see a correction of 23% to 38% in the minor swing. Conversely, if it breaks through or consolidates at this zone, the rally is likely to continue.
Alternate View:
The alternate view suggests that if the market initially declines, it could reach the 38% Fibonacci level in the minor swing. However, until the
BSE SENSEX analysis for 18th October 2023 for educational purposBSE SENSEX analysis for 18th October 2023 for educational purpose
This video is for educational purpose and my personal view . We are NOT SEBI registered Advisor, we only give the level on our practical trading experience. Kindly take the trade according to your risk and reward position and consulting your advisor. It is advisable to take the advice of SEBI registered advisor.
YOUR QUERY -
Trading analysis for tomorrow
Nifty price action analysis
Nifty bank nifty analysis
Nifty option chain a