Predictions and analysis
📊 DETAILS Sector: Pharmaceuticals & Drugs Mkt Cap: 3,512 cr Sequent Scientific is India's leading animal health company, with presence in 5+ continents across 100 countries. Sequent Scientific Limited provides a wide-ranging portfolio of animal health products, including Finished Dose Formulations, APIs, as well as analytical services to the pharmaceutical...
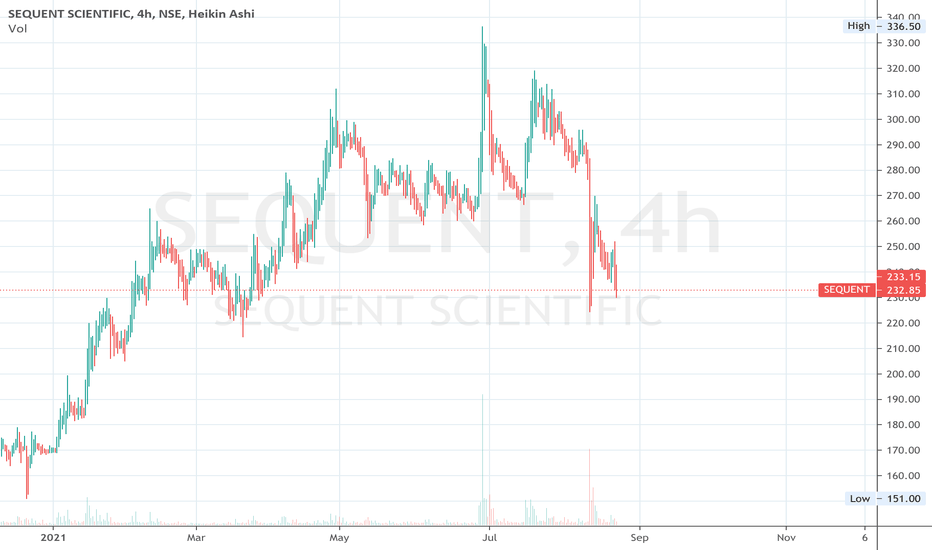
Sequent is looking attractive at this level and showing signs of a trend reversal from downside to upside. Keep a close watch and try to catch the move with your Swing trending set-up. Disclaimer - I am not a SEBI-registered technical analyst and advisor so contact your financial advisor and make a self-decision. I will not be responsible for any profit and loss
SEQUENT:- Stock has given strong breakout, if stock comes back for retesting then you can plan something Hello traders, As always, simple and neat charts so everyone can understand and not make it too complicated. rest details mentioned in the chart. will be posting more such ideas like this. Until that, like share and follow :) check my other ideas to get...
SEQUENT is underperforming for some time - looks like things are changing after tested bottom levels around 80. Crossing 120.95 levels - we should see good upside momentum on this -- add to watchlist. 14-07-2022 --- 101.4 Cross WK Piv Downside Close above 20 SMA on Daily time frame M/W RSI <40. & Daily RSI 40<>60: 20-07-2022 --- 119.05 Close crossed W-SMA-13...
Available at a good price for a long term investor. One can also take a swing trade. Note: Just for educational purpose.
CMP: 181 Stock has taken support near 140-145 level. Also completed 61.8% retracement from its all time high. Looks ready to go up. Expectation: 225, 267
CHART -> SEQUENT SCIENTIFIC DAILY SETUP As we can see on chart, Sequent Daily chart is giving three bearish trendline breakouts. MACD finally going positive after August. Huge volumes also in last 2 days. These factors should act as a forward looking journey for SEQUENT SCIENTIFIC. Disclaimer: This is for educational purpose only. This is not any...
Sequent scientific breakout is done. Adding more quantity. For long term only. #vr
Sequent Scientific NSE:SEQUENT Cmp - 232 Stop - Nil, Add more on relevant dips Expectation - T1 - 500 T2 - Open, Review at 500 Expected Holding Period - 12 months or earlier for T1 Technicals - ✅ Fundamentals - ✅ View:- Positional/Investment Disclaimer:- Ideas being shared only for educational purpose Please do your own research or consult your financial...
Previous rejections area and neckline of double bottom. Breaking 313 level can be good upside move. Resistance turned into support and pushing price upwards.
Wait for 1 Green Candle Buy above the High of that candle if it breaches 258s levels SL 258 Target 1: 304 Target 2: 328 Volume is huge in the upside whereas its very low during the fall Its a shake off from big players
Sequent Scientific took support on 30, 50, 100 SMA and bounced back after good Q4 results. Expect some good rally in the next 2-3 weeks if market general trend is upwards.
# sequent Tringle Pattern Breakout Happy Learning
🔰 MY thought process : ⭐Taking multiple support from lower trendline on D chart = strong support uptrend :) ⭐If it breaks the above trendline on 1hr = a good long till the near TOP, if it sustains those areas next target will be Target-2 ⭐Risk: below that power candle 🔰Am I taking this trade now: No---Reason: Already in the trades of Naukri and PPL as posted...
even though i have used Daily Chart , it just for understanding of my own.. was reading DARVAX concept somewhere and tried to make boxes on this chart since its a long term hold.. i dont know if i am right or not about darvax.. i just feel , the stock can multiply from here onwards.. i took fresh trading entry at 246 because of green huge candle forming and...


