SOL: Wave (4) Correction Toward $95?Solana (SOL) on the daily timeframe appears to be undergoing a corrective phase after completing a strong five wave impulsive advance within a rising parallel channel. The Elliott Wave structure suggests that wave (1) topped near $76.02 , followed by a correction to $63.97 in wave (2), before SOL rallied through waves (i), (ii), (iii), (iv), and (v) to complete the larger wave (3) at approximately $124.89 . This rally marked a significant recovery from the June low near $60.12 , with price
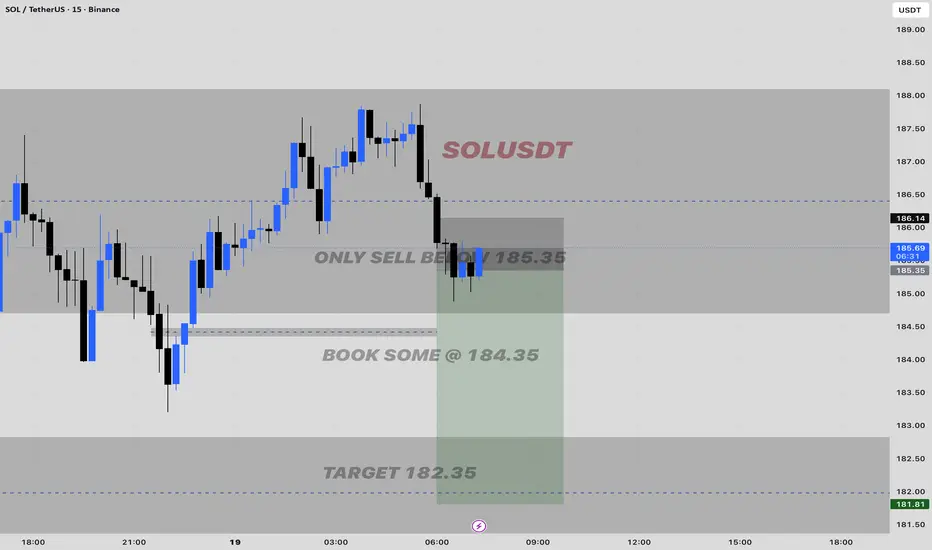
Solusdt
SOL Buyers Have a Second ChanceHello Traders! 👋
SOL has already delivered the expansion. After breaking out of its previous consolidation, price pushed toward $120 and confirmed that buyers are still active on the daily chart.
The $107–$110 area is where I want to see the market return. This zone was resistance before the breakout; a successful defense now would show that demand has moved higher and the market is accepting prices above the old range.
If that happens, I’ll be watching for a renewed push through $120, with $1
SOLUSDT: Channel Lost, 100 USDT Back to FocusSOLUSDT is trading around 102.76 USDT after breaking below the ascending channel that had been in place since early September. The price is currently sitting below both the EMA34 and EMA89 (near 104.0), indicating that the short-term structure is increasingly bearish.
The 103.2–104.5 zone now serves as a key resistance area, representing a confluence of the previous breakdown level and the EMA cluster. If SOL rallies to this zone but faces rejection, I anticipate a drop to 101.5, followed by an
SOL/USDT — Professional Technical Analysis🚀 SOL/USDT — Professional Technical Analysis
📊 Timeframe: 2H
💰 Current Price: ~105.09 USDT
🟢 Market Structure
SOL is still trading inside a bullish ascending channel, maintaining higher highs and higher lows. Price is currently consolidating after rejection from 110.59 resistance.
🎯 Key Levels
🔴 Resistance: 110.59
🟡 Short-term Support: 102–104
🔵 Channel Support: 98–100
🟢 Major Order Block: 94.5–96.3
📈 Bullish Scenario
If SOL holds 102–104 and breaks above 106–108, the next target could be 1
SOLUSDT: Breakout Confirmed — Is 105 Next?SOL has pushed decisively above the resistance zone that capped price earlier. The breakout came with strong momentum, which tells me buyers are not simply testing the level—they are trying to take control of it.
After a move like this, a pullback into the broken zone would be healthy. The key is whether price can return there and hold above it. If former resistance starts acting as support, the breakout gains much more weight.
As long as buyers protect that area, the path toward 105 remains o
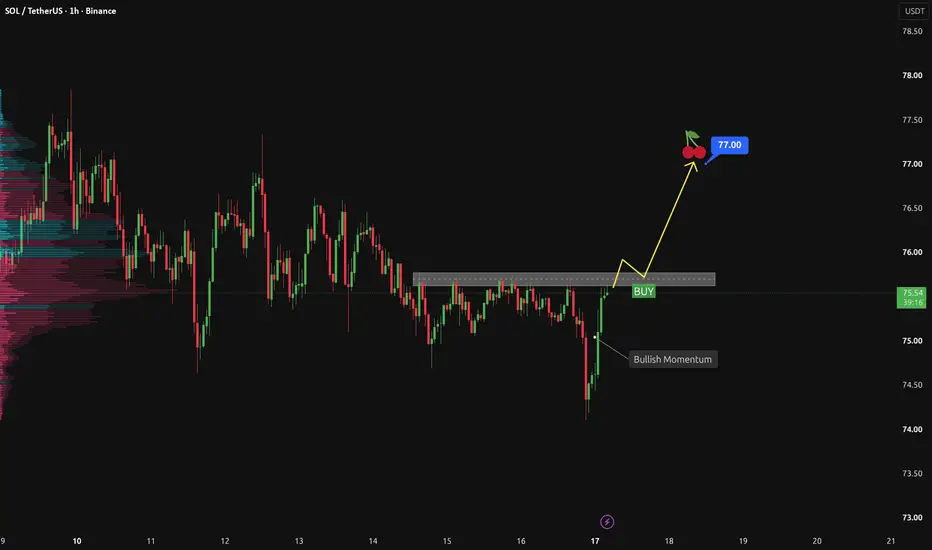
SOLUSDT Is Waiting for a Breakout. Could 77.00 Be Next?SOLUSDT is currently approaching the key resistance zone between 75.60 and 75.75, an area that has capped several previous recovery attempts. For me, this is not the time to rush into a long position. I want to see price break clearly above the zone, then return to retest and hold it as new support.
If the retest produces clear bullish confirmation, such as a strong rejection wick or increasing buying volume, it could signal that buyers have regained control. In that case, my next target would
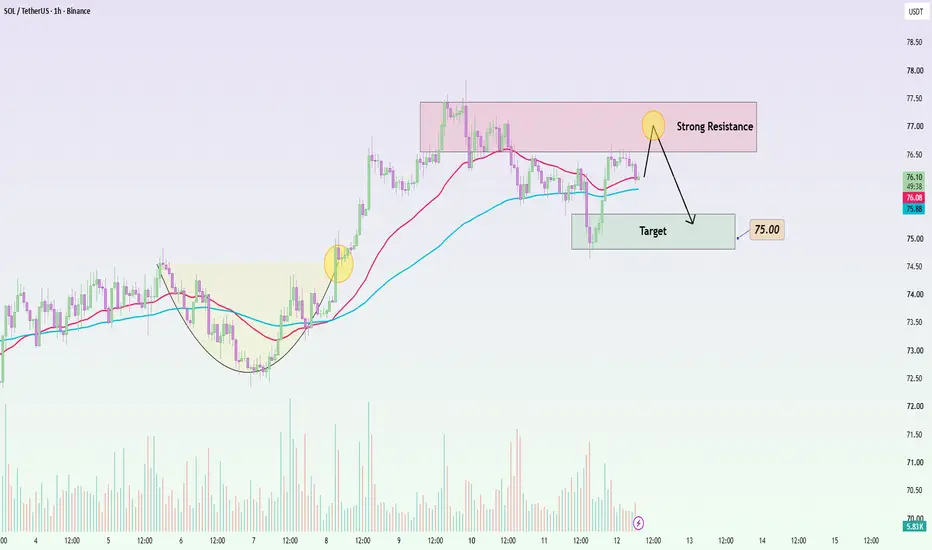
SOLUSDT: A Tough Hurdle for the BullsSOLUSDT is hovering around 76.0 USDT; despite a rebound from the 75 level, it has yet to break past the 76.6–77.4 USDT resistance zone.
Macro factors currently favor a correction scenario. The USD is edging up, Bitcoin remains under pressure near the 63.6K mark, and the crypto market is maintaining a cautious stance ahead of the US CPI data.
On the 1-hour (H1) chart, if SOL continues to face rejection at the 76.6–77.4 range, I lean towards the likelihood of the price retesting 75.0 USDT. The b
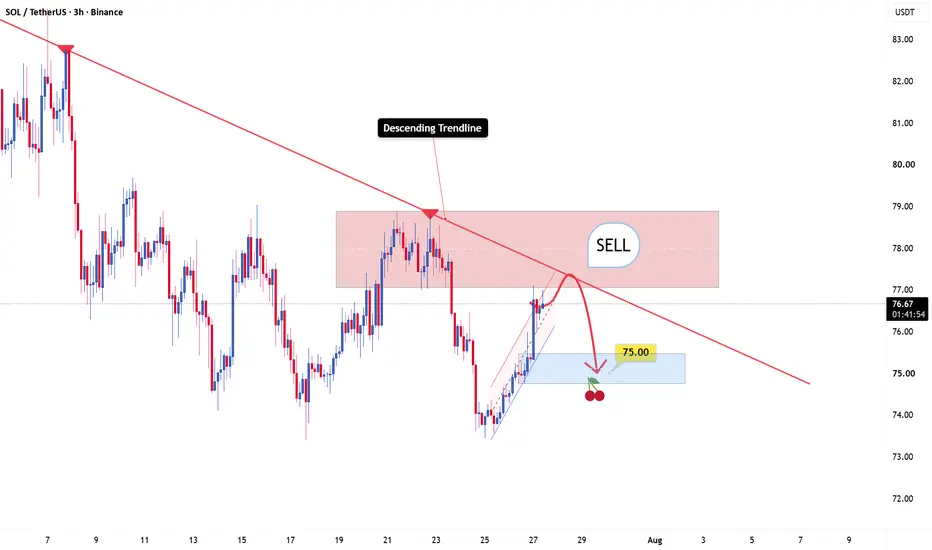
SOLUSDT: A Short-Term Pullback Could Be ComingSolana has shown strong recovery momentum recently, with buyers stepping in aggressively after the sharp decline.
However, I don’t think this upside move will continue without facing resistance. The current structure is starting to approach an important area where sellers have previously defended, and this could create some short-term pressure.
Right now, SOL is testing a key resistance zone formed by the descending trendline and the supply area around 77.00–79.00. This zone has acted as a bar
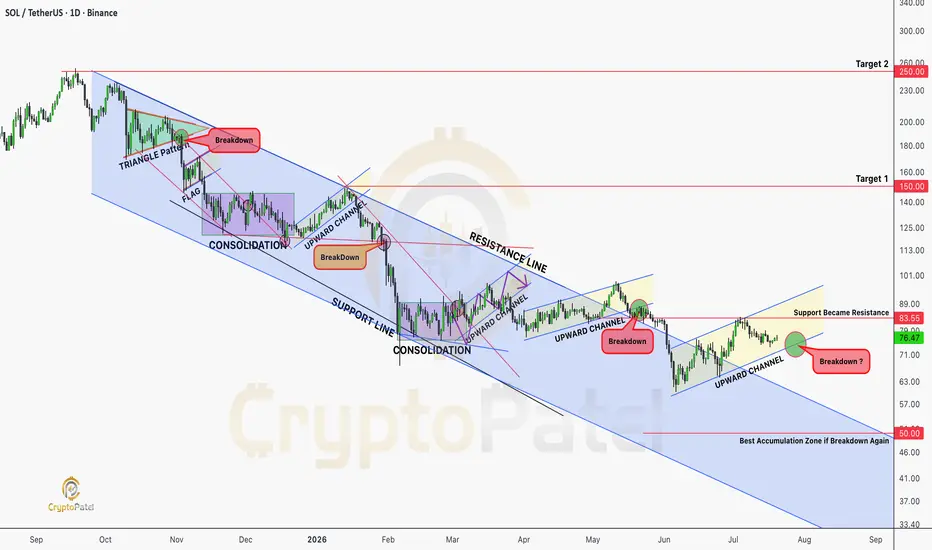
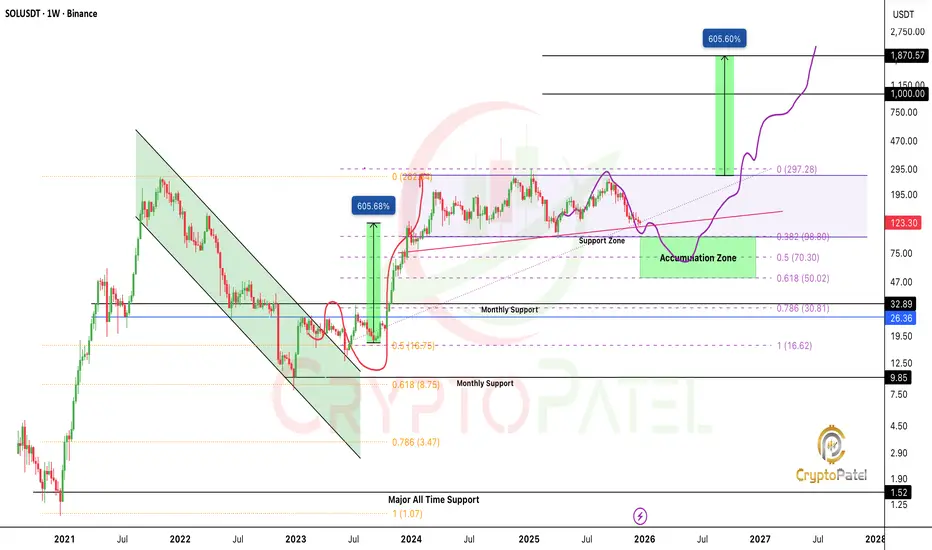
Will Solana Potential $1000 in Next Altseason?CRYPTOCAP:SOL Is Sitting At A Critical HTF Decision Point.
Lose This Rising Channel And A Move Toward The $70–$50 Accumulation Zone Becomes Increasingly Likely. Bulls Must Defend.
Long Term, I'm Highly Confident CRYPTOCAP:SOL Can Reach $500, Then $1,000. That's Why $70–$50 Looks Like A High-Conviction Accumulation Zone For Patient Investors. 🚀
NFa & Always DYOR
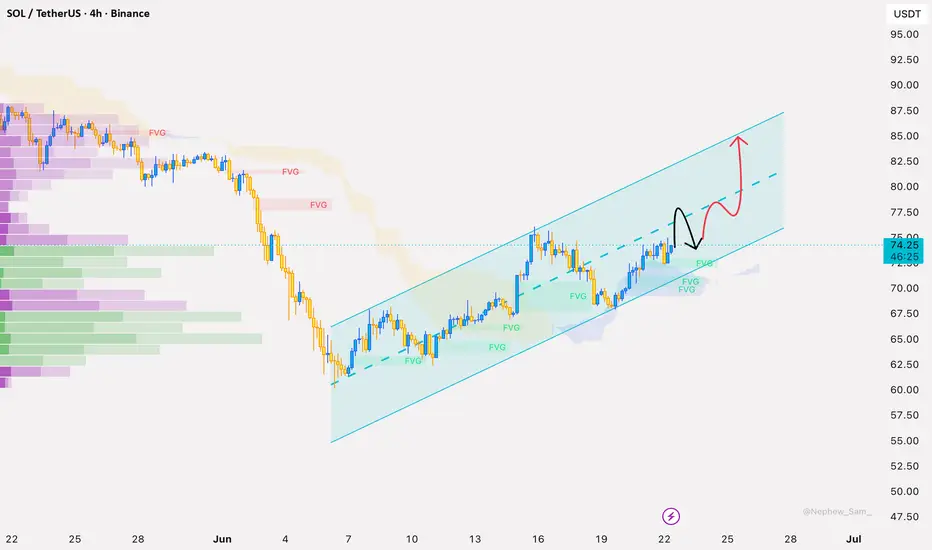
Solana Builds Strength Above $72 as Bulls Target $80Solana continues to build a constructive recovery structure after rebounding from the $61–62 area. The latest move above $72 suggests buyers remain active, while recent pullbacks have been relatively shallow.
For crypto traders, the key zone now sits around $74–76. A breakout there could attract fresh momentum buyers and open the path toward higher levels.
Trade Setup:
Buy Zone: $72.00 – $73.00
Stop Loss: $69.50
Take Profit 1: $76.00
Take Profit 2: $80.00
Take Profit 3: $82.00
As long as SOL
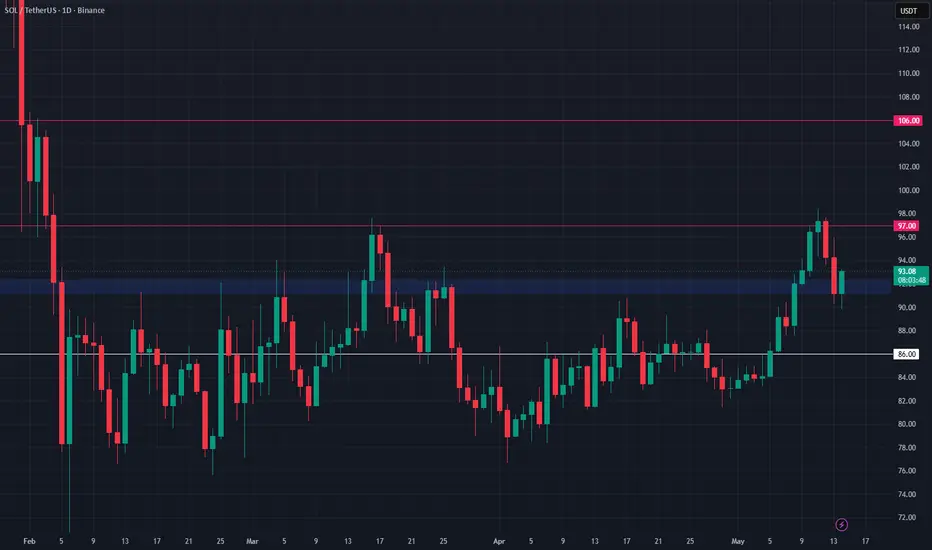
SOL Approaching Key Support — Long Swing Setup SOL is now approaching an important support zone around $91–$92, and this area could provide a good opportunity for a long swing setup. Price has pulled back, but if buyers defend this level, we may see a recovery move toward the next resistance zones.
Trading Levels:
Entry Zone: $91 – $92
Take Profit 1: $97
Take Profit 2: $106
Stop Loss: $86
Trade Type: Long Swing Trade
Risk Level: Medium
SOL/USDT (1D): Accumulation Complete? Breakout ImminentMarket Context:
Solana (SOL) has been locked in a massive daily accumulation phase since the sharp market correction in February. For over three months, the price has built a rock-solid foundation, and we are now witnessing a steady, aggressive push toward the upper boundary of this long-term range.
Technical Breakdown (Daily Timeframe):
The Accumulation Range: SOL has been perfectly respecting the structural boundaries—absorbing sell pressure at the $70 - $80 Demand Zone (lower pink box) a
SOLUSDT: Slowly Building Pressure for the Next Wave C RallySOLUSDT on the daily chart is starting to regain strength after holding the broader ascending structure from the 76 low. Price spent the last few weeks consolidating above the trendline instead of breaking below it, which shows buyers are still defending the higher timeframe trend. The recent push back above the 90.73 resistance area is an early sign that momentum may be shifting back toward the upside.
The corrective move also looks relatively controlled compared to the earlier rally. Instea
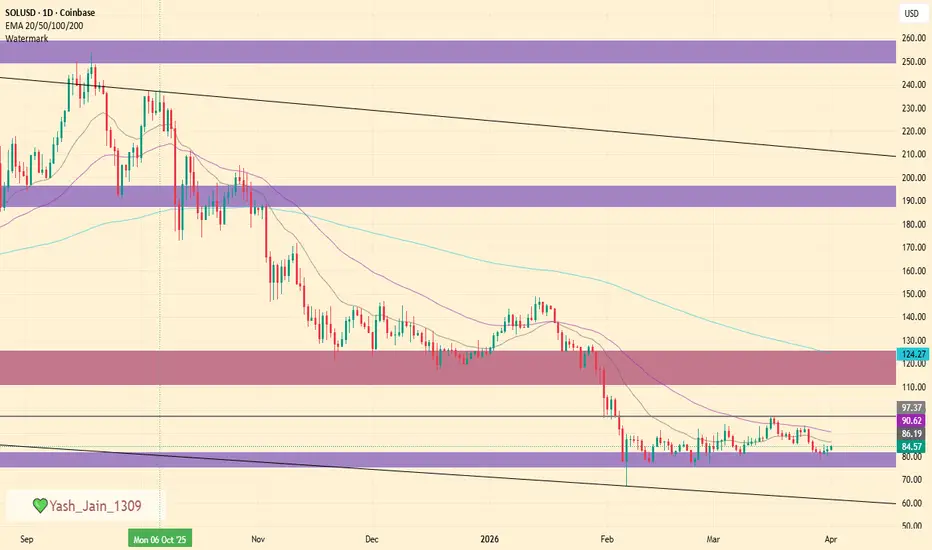
Is SOL bottoming phase near or not there yet? What it is
As we consider the current price action of COINBASE:SOLUSD , there are two key observations worth noting. First, it has been consolidating around the $80 mark since February.
Additionally, the downtrend from approximately $250 appears to be part of a significant correction, leading many analysts to anticipate a potential bottoming phase in COINBASE:SOLUSD . It's important to remember that, alongside the horizontal support zones, there exists a dynamic falling channel whose lower bounda
Will SOLANA potentila to $1000?Many people are emotionally attached to Solana and the $1,000 target and that may be possible long term.
But markets never move straight up.
Corrections are part of every cycle, and CRYPTOCAP:SOL is currently in a correction phase.
If the $120 support breaks, I’m expecting SOL to drop below $100.
A move under $100 could offer a strong long-term accumulation opportunity.
My accumulation zone: $98 – $50
Long-term outlook: $500 – $1,000
Crypto is highly volatile and risky.
Always DYOR, manage
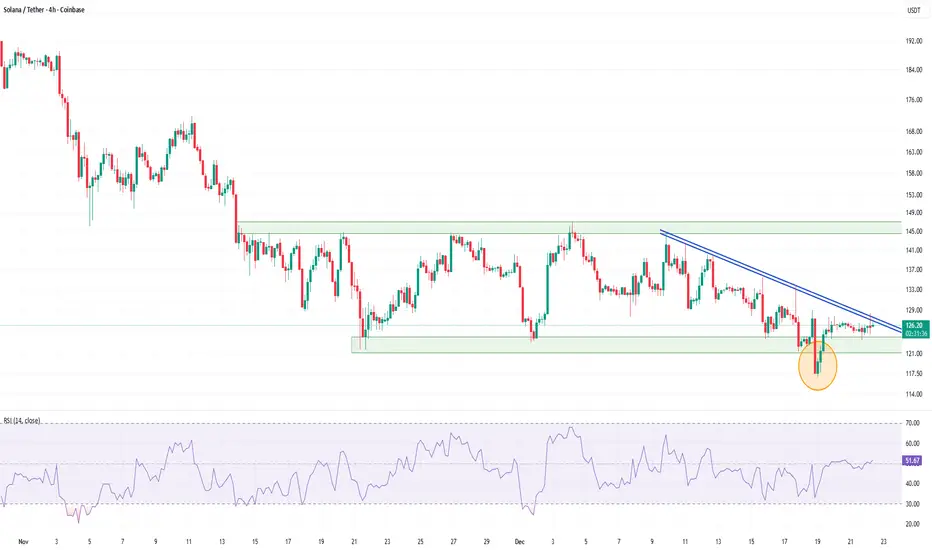
Solana Technical Reversal: MA Compression Resolves to the UpsideSolana is trading around 126 levels and there is a support which is being respected around 125 levels.
For last few weeks, no considerate candle is there. Only doji are being formed which shows the sideways moment in the charts.
If the market cycle changes, turning bullish, an entry can be made above 127 levels expecting a 10-11% movement in the crypto.
Major trend is bearish, Minor trend sideways.
The major support is around 100-110 level zone and there is not much of fall to capture as it
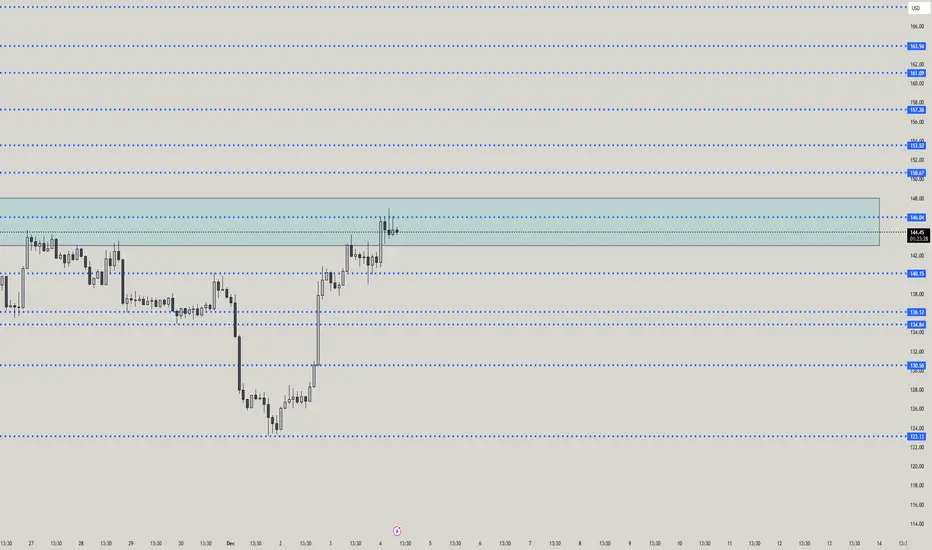
SOLUSD COMPLETE TRADING PLAN (BUY, SELL, NO-TRADE ZONES)PRICE IS CURRENTLY INSIDE A SUPPLY / SELL ZONE
The light-blue highlighted area is a strong supply zone between:
🔵 Supply Zone (Sell Zone)
146.00 – 149.00
Price has tapped this zone 3 times → weakness for buyers → sellers may take control.
🚫 NO-TRADE ZONE (RIGHT NOW)
The region where price is stuck is:
🚫 No-Trade Zone: 144.00 – 146.00
Reason:
Price is consolidating
Multiple rejections
Both bulls & bears fighting
Not safe for entering until breakout or rejection confirmation
🔥 SELL SE
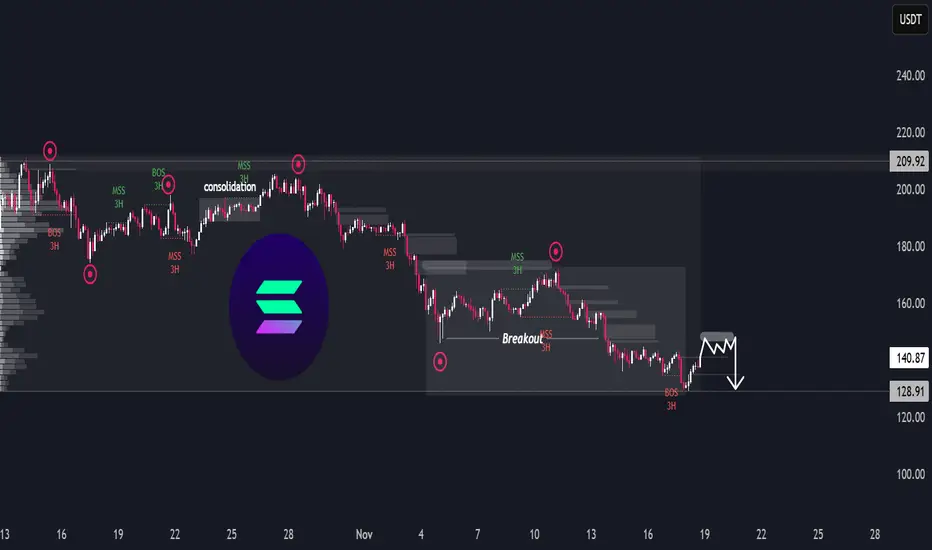
SOL/USDT – Downside LoadingSOL/USDT – Downside Loading
The chart shows a prolonged distribution phase followed by a steady macro decline, with multiple structure breaks confirming a persistent bearish flow. After the earlier consolidation in the upper range, each attempt to reclaim previous highs has been met with a shift in momentum, leading to progressive downside sequences.
The recent breakout from the lower range transitioned into continued weakness, indicating sellers remain in firm control. Despite short-term reb
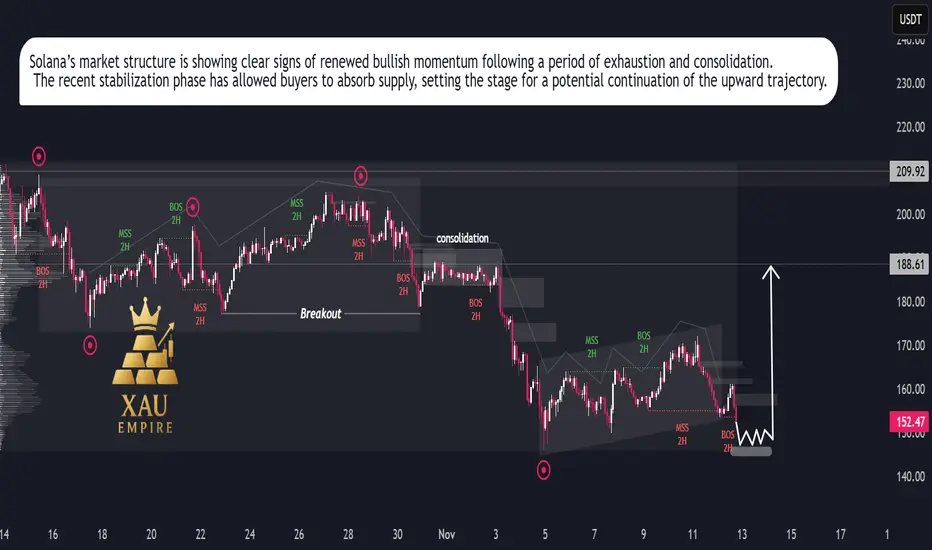
SOL/USDT – Bullish Momentum Rising, Rally Setup in ProgressSolana is showing renewed strength after an extended corrective phase, suggesting that the recent slowdown was a temporary reaccumulation rather than the start of a new downtrend. Price action has begun to stabilize, reflecting growing investor confidence and increasing participation from buyers at discounted levels.
Market flow indicates that selling pressure is fading, while buying volume has started to build up gradually. The recent structure reflects a healthy market rotation, where weaker
Solana Price Action Turns BearishSolana’s market structure shows a gradual weakening of bullish momentum after an extended upward phase earlier in the month. The asset experienced a breakout that temporarily fueled optimism among traders, but recent sessions indicate a loss of strength as sellers began to dominate. The volume profile suggests that market participants are shifting focus from accumulation to potential distribution, reflecting caution ahead of broader market developments.
Price movements over the past few weeks s
SOL/USDT (1H timeframe)...SOL/USDT (1H timeframe):
Here’s a clear technical breakdown 👇
🧭 Chart Overview:
Current price: around $200.40
Trend: Uptrend, but showing short-term pullback
Support area: $190 – $195
Resistance area: $205 – $210
🔍 Key Observations:
The ascending trendline is acting as dynamic support.
Price recently rejected near the $210 resistance zone and is pulling back toward the trendline and Ichimoku cloud.
The target points marked on my chart suggest downside retracements if support breaks.
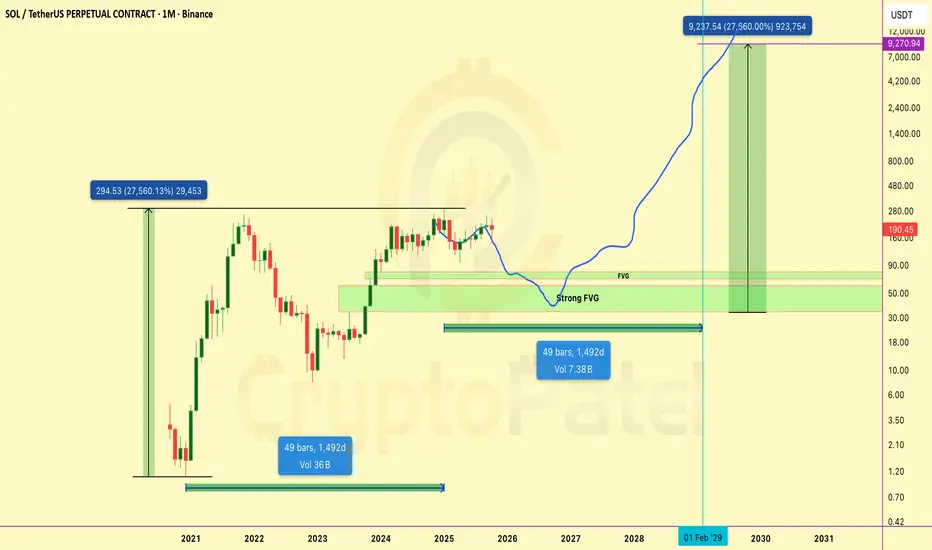
SOLANA 27,560% CYCLE IS ABOUT TO REPEAT - $9,200 TARGET BY 2029 SOLANA 27,560% CYCLE IS ABOUT TO REPEAT - $9,200 TARGET BY 2029
Previous Bull Cycle Metrics:
1️⃣ Duration: 1,492 days
2️⃣ % Gain: 27,560%
3️⃣ Price: $1 → $295
Now here's where it gets CRAZY...
IF we get a healthy retracement to the golden pocket ($60-$35), and IF the fractal repeats:
1️⃣ Bottom: $60-$35
2️⃣ Same % gain: 27,560%
3️⃣ Same timeframe: 1492 days (Feb 2029)
This is Wyckoff accumulation into parabolic expansion.
The risk/reward is GENERATIONAL
Bookmark this. Screenshot this. Thank
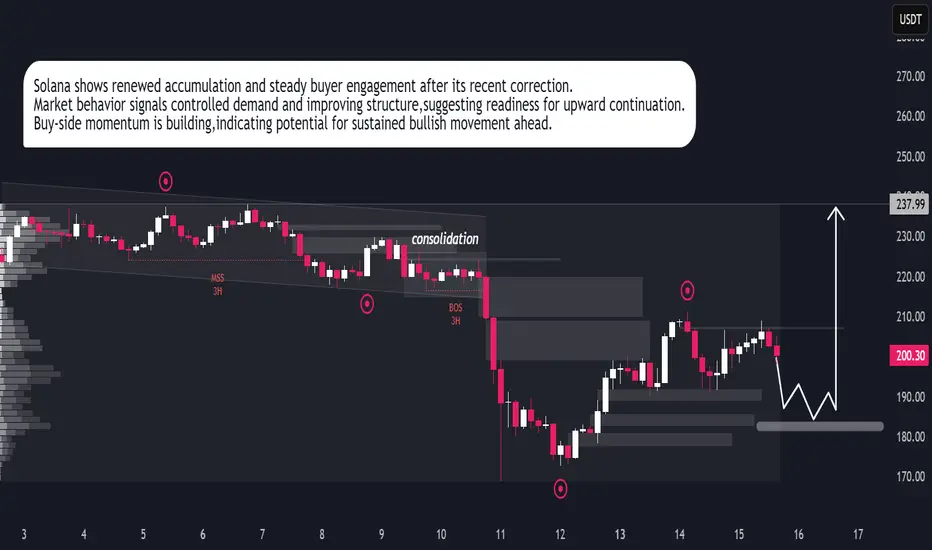
Solana Ready for Bullish ContinuationSolana demonstrates a constructive market posture with evidence of renewed accumulation following its recent corrective phase.Price activity indicates that buying momentum is gradually strengthening as liquidity continues to shift from weak hands into strategic positioning.The market structure shows improving stability,with compression patterns hinting at an impending expansion cycle.Sustained absorption near recent lows underscores growing institutional participation,reinforcing the probability