The Chart That Could Send $SOL to $6,000: Cup & Handle on 3W TFThe Chart That Could Send CRYPTOCAP:SOL to $6,000: Cup & Handle on 3W Timeframe
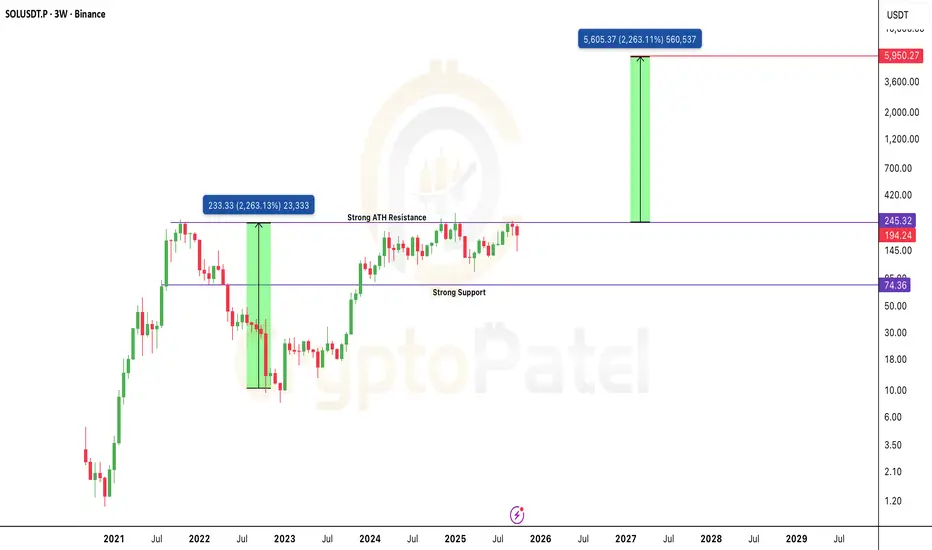
Solana is shaping one of the cleanest Cup & Handle patterns on the 3-Week chart, a formation that often signals the start of a massive long-term rally.
Technical Structure
🔹 Cup formed: $260 → $8 → back to $245 — a perfect rounded recovery base.
🔹 Handle forming: Price consolidating between $140–$245, building pressure before breakout.
🔹 Breakout trigger: Clean close above $245 (ATH zone) will confirm the move.
🔹
Solusdt
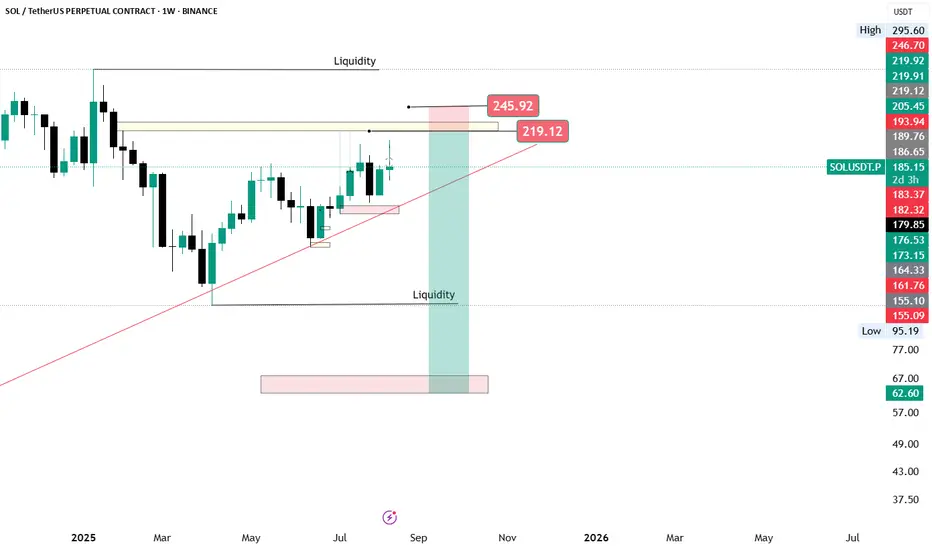
SOL | Network Strength Meets Market MomentumSolana (SOLUSDT) continues to show resilience as both technical and fundamental factors align for potential upside. On the technical side, the market has completed a controlled correction phase, suggesting liquidity buildup below recent lows. The structure remains bullish, with increasing volume and price stability hinting that buyers are regaining control. Fundamentally, Solana’s network growth and strong developer activity have reinforced investor confidence, supported by rising on-chain activ
SOL Ready TO Ignite from Demand - Eyeing $240 Supply “SOL Ready to Ignite from Demand – Eyeing $240 Supply”
📌 Description:
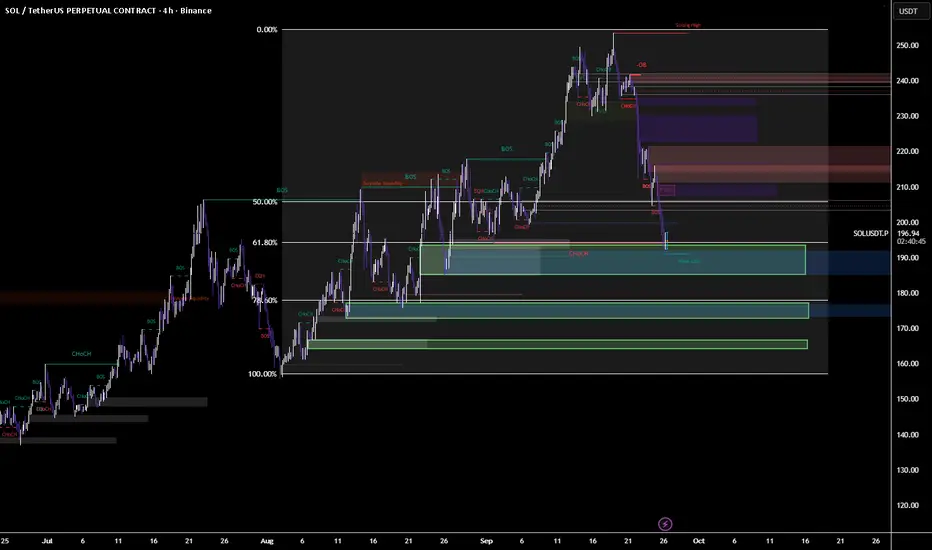
Solana swept liquidity into the $192–195 demand zone and is showing signs of strength. As long as $185 holds, bulls may drive price into the $210–240 supply zones. First target sits at $210 (FVG close), with higher objectives at $225 and $240. If demand fails, watch for a rejection short from $210.
Long Setup (Buy Idea)
Entry Zone: $192 – $195 (current demand + weak low + 61.8 retracement support)
Stop Loss (SL): $185 (be
Solana Price Forecast | SOLUSDT Market OutlookSOLUSDT has completed a strong upward cycle and is now unwinding through a structured retracement. This phase is not showing disorderly selling but rather a controlled reset, where liquidity is being cleared to prepare for the next expansion.
The chart reflects a market that is cycling through accumulation, breakout, and pullback phases with consistency. Current downside movement is shaping a foundation zone that could serve as the springboard for renewed upward momentum.
Overall, the asset is
Solana: The Scam or the Breakthrough? | PipGuardSolana: The Scam or the Breakthrough?
Hello there, my colleagues, welcome back!
Article published by PipGuard™ on the TradingView® platform – to continue this free publication, LEAVE A BOOST and a COMMENT, hit the notification bell, and never miss ANOTHER ANALYSIS.
ANALYSIS
Hello everyone,
I know many of you appreciate my analyses, and I thank you for the support. As you know, I spend most of my time on the charts, looking for the best trading opportunities. To avoid missing updates, I re
Sol 1 Pending Market Crash so wait for thisSol 1 Pending Market Crash so wait for this
Sol 1 Pending Market Crash so wait for thisSol 1 Pending Market Crash so wait for thisSol 1 Pending Market Crash so wait for thisSol 1 Pending Market Crash so wait for thisSol 1 Pending Market Crash so wait for thisSol 1 Pending Market Crash so wait for thisSol 1 Pending Market Crash so wait for this
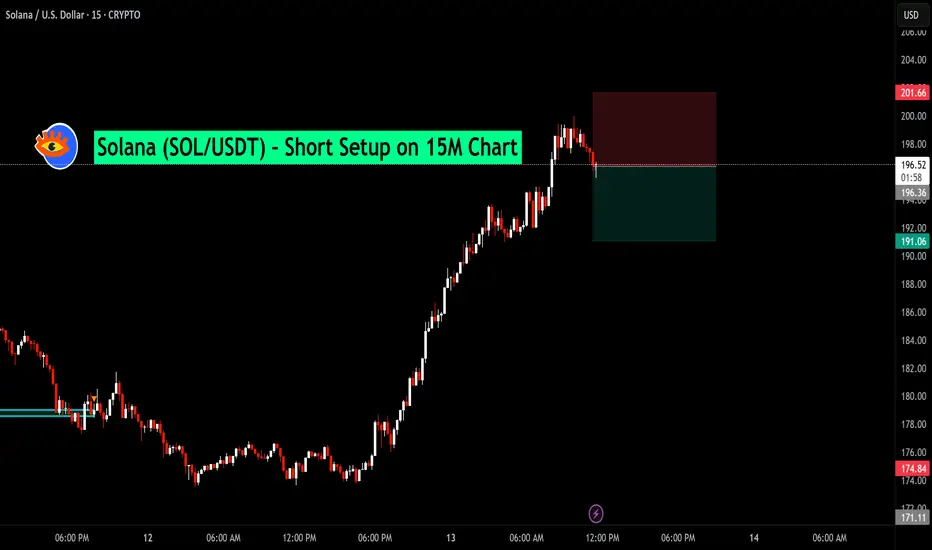
Solana (SOL/USDT) – Short Setup on 15M ChartAfter an extended bullish run, Solana is showing early signs of exhaustion near the $196–$197 zone. Price has failed to sustain above recent highs, forming a potential short-term reversal pattern.
📉 Trade Idea:
Entry: $196.40
Stop Loss: $201.66 (Above recent swing high)
Target: $191.06 (Support zone from prior consolidation)
This setup aims to capture a pullback move following a strong rally, with a favorable risk-to-reward ratio.
SOL/USDT 1H Chart Analysis – Bullish Reversal Targeting Resistan🚀 SOL/USDT 1H Chart Analysis – Bullish Reversal Targeting Resistance Zone 🎯
📊 Pair: SOL/USDT
🕐 Timeframe: 1H
📈 Platform: Binance
🔍 Technical Overview:
🔵 Support Zone (145.00 – 147.50 USDT)
Price has bounced multiple times from this strong demand zone marked in light blue.
Recent price action shows buyers defending this level aggressively — potential accumulation area. ✅
🔴 Resistance Zone (159.50 – 162.00 USDT)
Marked in red, this zone has historically rejected price twice (confirmed by red
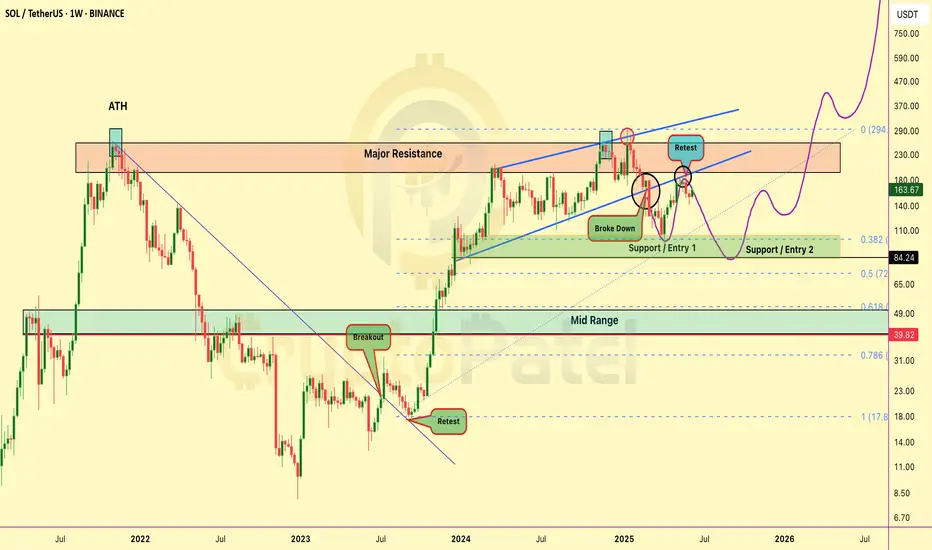
Is $SOL about to DUMP… or set up a MASSIVE BUY ZONE?Is CRYPTOCAP:SOL about to DUMP… or set up a MASSIVE BUY ZONE?
Solana is now at a critical level on the higher timeframe chart:
✅ After a breakdown, SOL is now retesting the bearish retest zone
✅ Strong resistance seen at $170–$180
✅ If rejected → price could dip toward the $100 range
But here’s the key: A dip to $100 would be a massive long-term buying opportunity for many investors (including me).
Long-term targets? I’m still eyeing $500 → $1000 if the macro trend plays out.
👉 Keep a clos
MY ANALYSIS IS HITTING THE TARGET! WHAT A CATCHING VIEW!🎯🔥 MY ANALYSIS IS HITTING THE TARGET! WHAT A CATCHING VIEW! 🔥🎯
✨📈 Everything is playing out as I expected – let’s keep riding this wave! 🌊💹
🚀 SOL/USDT Analysis Update 🚀
📅 Date: June 11, 2025
📊 Timeframe: 4H
✅ Key Zones & Levels:
🟢 Support Level Zone: 144.00 – 147.24
🔴 Resistance Level Zone: 184.00 – 187.99
⚠️ Mini Support/Resistance: Around 160.00
🎯 Current Price Action:
The price has respected my previously marked Support Zone (🟢), resulting in a strong rebound. After forming a bottom at the
SOL/USDT 4H Chart Analysis📊 SOL/USDT 4H Chart Analysis
🟢 Key Zones:
🔴 Resistance Level Zone:
Marked at approximately 185–188 USDT
Multiple rejections in this area (red arrows 📉), confirming it as a significant supply zone.
🟩 Support Level Zone:
Found around 140–147 USDT
Price has previously bounced off this zone (green arrows 📈), indicating strong demand.
⚖️ Mini Levels:
🟡 Mini Support/Resistance:
Around 157 USDT, previously acted as both support and resistance (yellow box).
Price reacts to this zone during its
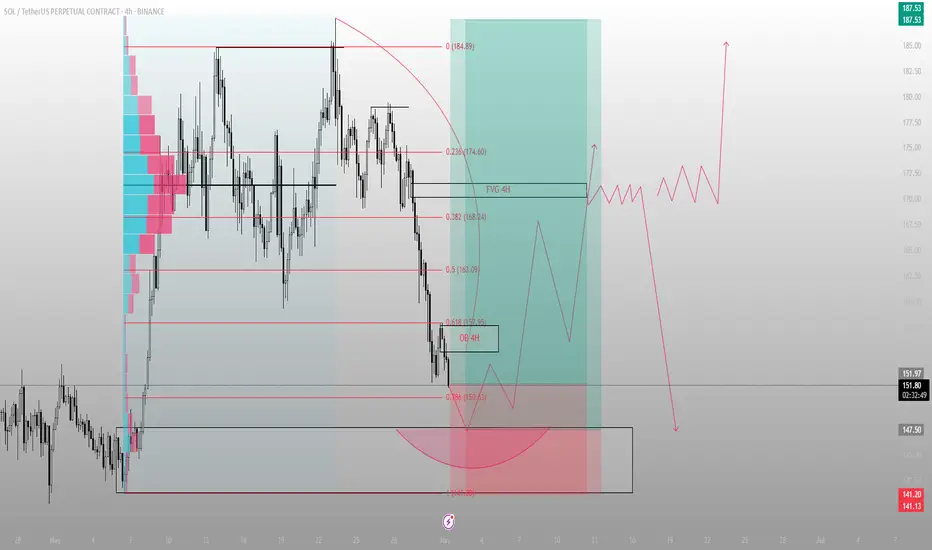
Liquidity tagged. Sentiment shaken. Now the real move begins.SOL just kissed the 0.786 retracement at 150.6 — and did so with precision, not hesitation.
Below that sits a 4H OB that hasn’t been touched since the impulse leg began. That zone, now swept, resets the auction. We’ve completed the delivery cycle down, and Smart Money is reloading while the herd panics.
The rejection from this OB aligns with a thin LVN pocket — a classic bounce zone for engineered reaccumulation. From here, I’m watching for expansion into the inefficiency above: the 4H FVG at
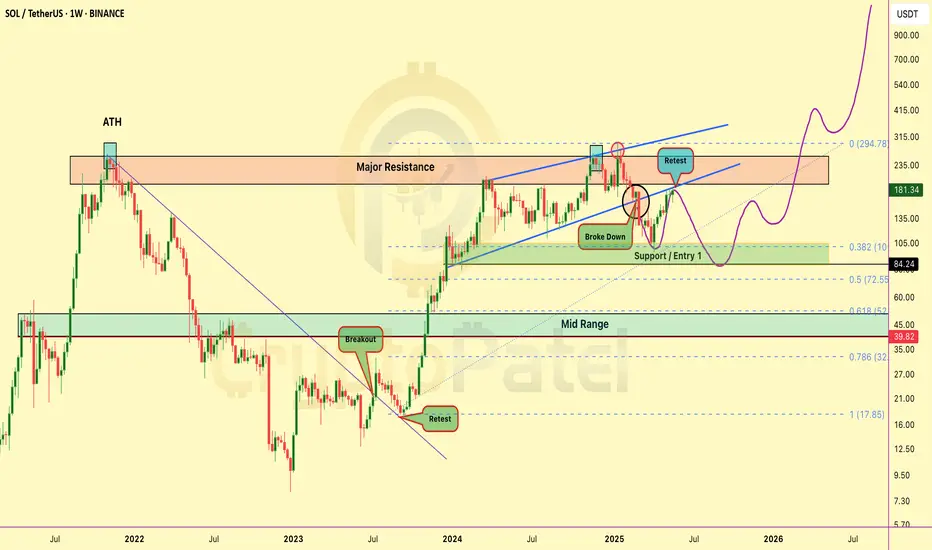
Bearish Setup Loading on Solana? Bearish Setup Loading on Solana? Watch This Key Level Closely
Solana just retested the breakdown zone after losing key support — currently sitting in a danger zone.
Short Interest Zone: $180 – $190
If this area holds as resistance, we could see another move below $150 soon.
Bearish Setup Invalidation: Break above $200 will flip this bias.
Long-Term View? I’m still super bullish on SOLANA in the bigger picture — my long-term target remains $1000 🚀
Risk Management is Key
Never trade without a
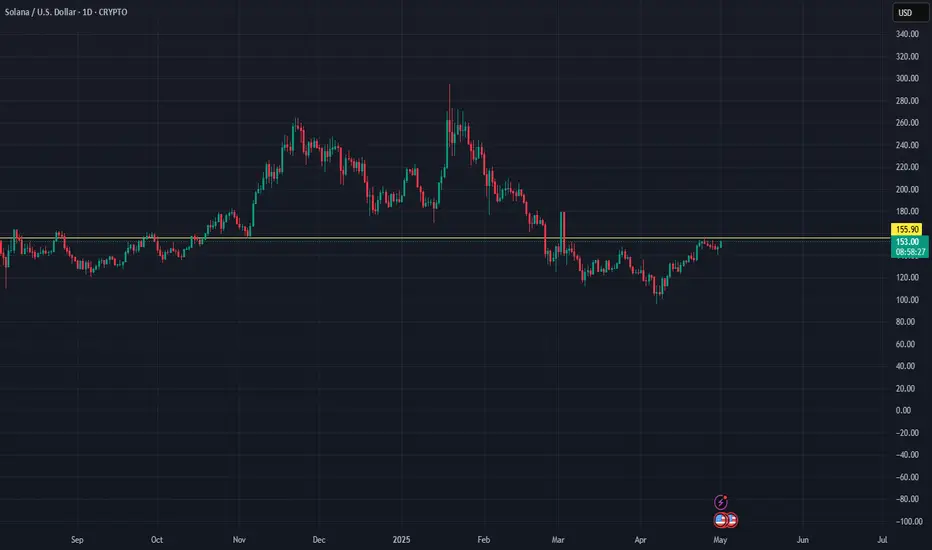
Solana (SOL) Analysis & Long Trade Plan – May 2025Solana ( CRYPTO:SOLUSD ) has re-emerged as one of the strongest Layer-1 blockchain plays, continuing its impressive recovery and adoption since the FTX fallout. With major ecosystem developments, lower fees, and blazing-fast throughput, SOL is now more than just an "Ethereum killer"—it’s a key pillar of the next wave of decentralized apps.
🔍 Current Technical & Fundamental Snapshot
Price: ~$151 (as of May 1, 2025)
Market Cap: ~$71B
24h Volume: ~$2.1B
Rank: Top 5
TVL: Over $4.2B
NFT
SOLUSDT - PRE BREAKOUT CONSOLIDATION - BREAKOUT ON THE HORIZON?Symbol - SOLUSDT
CMP - 134.70
SOLUSDT recently exhibited a false breakdown near the lower boundary of its established range. The market responded positively, with price action recovering and consolidating just below a key resistance level.
Bitcoin is also undergoing a consolidation phase. While both Bitcoin and SOL display similar movement patterns, Bitcoin has recently shown stronger correlation with equity markets and appears to be taking the lead.
Currently, SOLUSDT is consolidating below
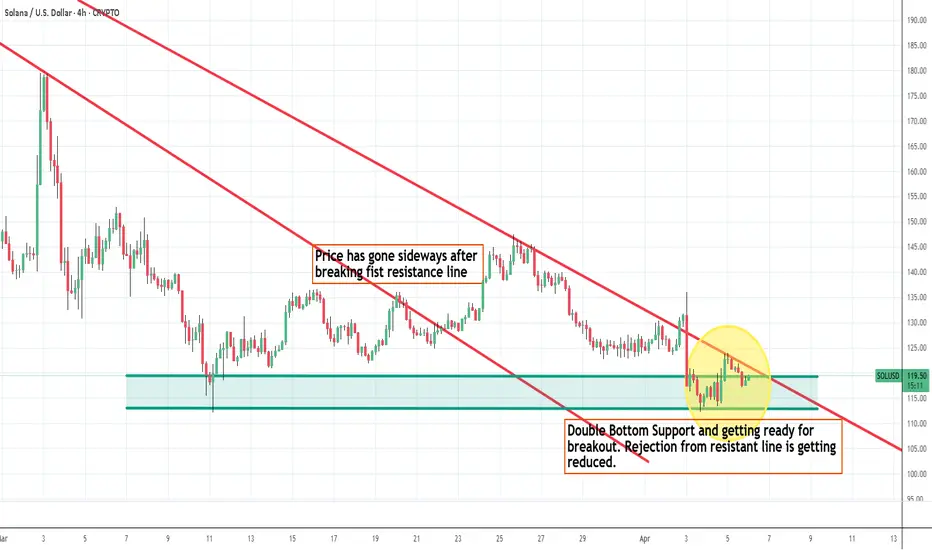
SOL - Getting ready for Big Breakout.Price has taken double bottom support. Price rejection from second resistance line is getting reduced. Any up move from BTC, SOL will give bigger breakout for sure. So trend will follow in whichever side price breaks the lines. I think not much downside can be seen in SOL since it has fallen from 250 levels to this low. SOL is next to BTC and ETH right now and its widely used. Price is at very attractive levels keeping ETF approvals in few weeks or 2 months this year. SOL is also one of the coin
Solana 4H Swing Long Entry Setup - Solana is currently trading at 128.8$
- Solana is trying to shift its market structure to bullish, and this will be confirmed once we see a flip above 136-139$
- Solana on a 4H TF is trying to build a consolidation base which should eventually lead to a larger expansion
- Solana and the whole crypto market is currently waiting for a bullish catalyst in order to move higher
- We have 4 central banks speaking this week all eyes on what Jerome Powell will comment and this will dictate the price
SOLANA: Too good to miss!1. 15-20% Risk
2. Price is near it's major support area.
3. EMAs are supporting the bullish view.
✨NOTE: Don't forget to have a look to my earlier Bitcoin post, it was a good one. Even though SL was hit on the 1st entry due to whipsaw, 2nd re-entry was pretty awesome. ⚡
⚠️ Disclaimer: This is NOT a buy/sell recommendation. This post is meant for learning purposes only. Views are personal. Please, do your due diligence before investing.⚠️
💬 What are your thoughts on this share it in the commen
SOL Long OpportunityMarket Context:
SOL has seen a significant drop in recent weeks but has now entered a key support zone. This could present a potential bounce to test the next resistance levels.
Trade Details:
Entry Zone: $132 - $144
Take Profit Targets:
$168
$195
Stop Loss: Just below $130
This setup aims to capture a potential recovery as SOL stabilizes at support and looks for upside continuation. 🔥
SOLANA - BULLISH OUTLOOKSymbol - SOLUSDT
SOLUSDT is currently testing its trend support, with bulls attempting to maintain their position above the intermediate bottom and establish a foothold in the buy zone. Both from a fundamental and technical perspective, SOLUSDT shows promising potential. At present, Bitcoin is in a consolidation phase, which may present an opportunity for strong altcoins to gain momentum.
From a technical standpoint, Solana has touched the trend support and is now attempting to consolidate. Al
SOL Eyes 40% Surge: Strong Technical PatternsKey Observations:
1. All-Time High (ATH): Marked at 259.59, indicating a significant resistance level.
2. Bullish Patterns Identified:
• Higher High (HH) and Higher Low (HL) Structure:
• This indicates a bullish market structure where price is making consistent higher highs and higher lows.
• Fair Value Gap (FVG):
• An imbalance or inefficiency in the price that could act as a magnet for price to revisit before continuation.
• Bullish Triangle Pattern:
• Suggests price consolidation with