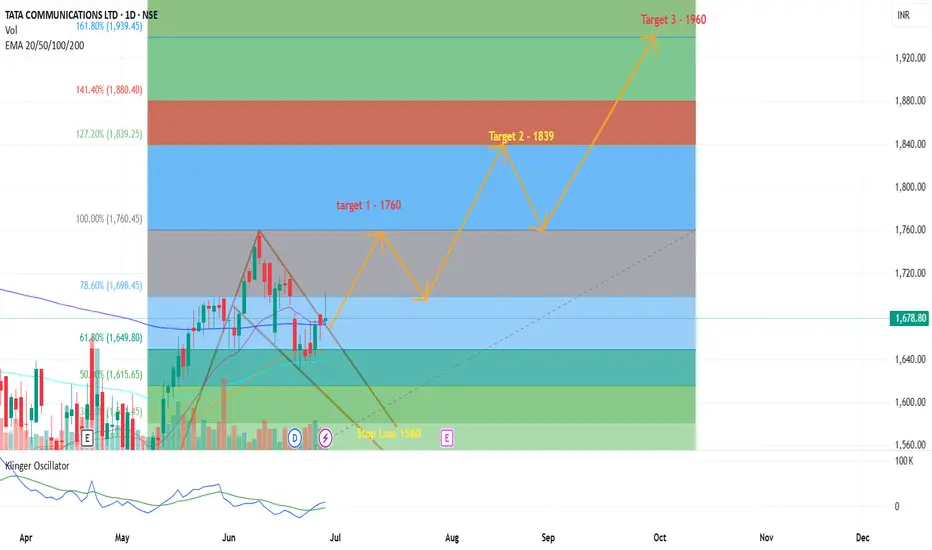
Tata Communication Swing scenarioTata communications is forming a good high RnR swing trade scenario. It is taking support from 685-690 Zone and changing the delivery. Now we should keep close eyes on POI for price action. We may see a good buy scenario if price action is supported by volume.
Please do follow me if you liked the idea💡...
Disclaimer ⚠️:This analysis is for educational purposes only and does not constitute investment advice. Please do your own research (DYOR) and check with your financial advisor before making
Tatacommunication
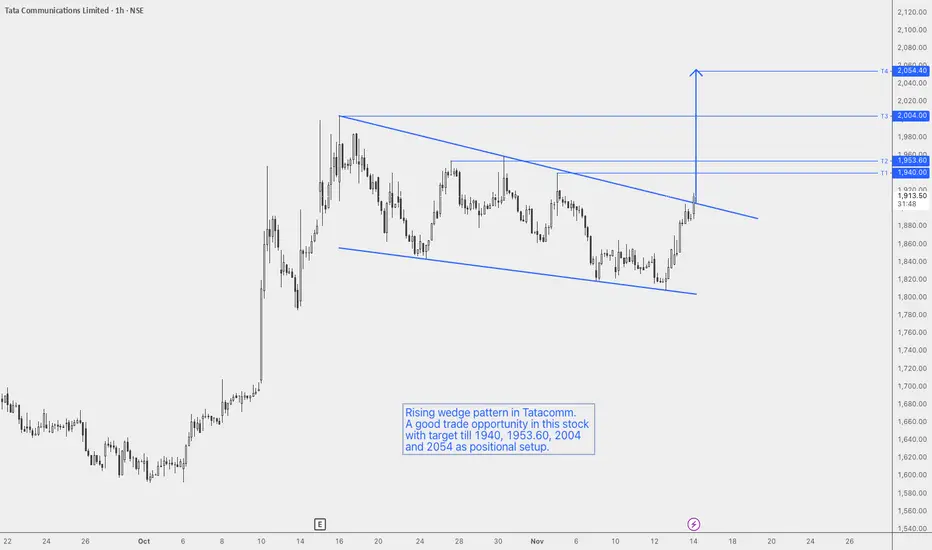
Rising Wedge in TatacommunicationsRising wedge pattern in Tatacomm.
A good trade opportunity in this stock with a target till 1940, 1953.60, 2004 and 2054 as a positional setup.
The pattern will be invalidated if the price reenters the wedge.
Validation for entry on breakout and test of wedge as support.
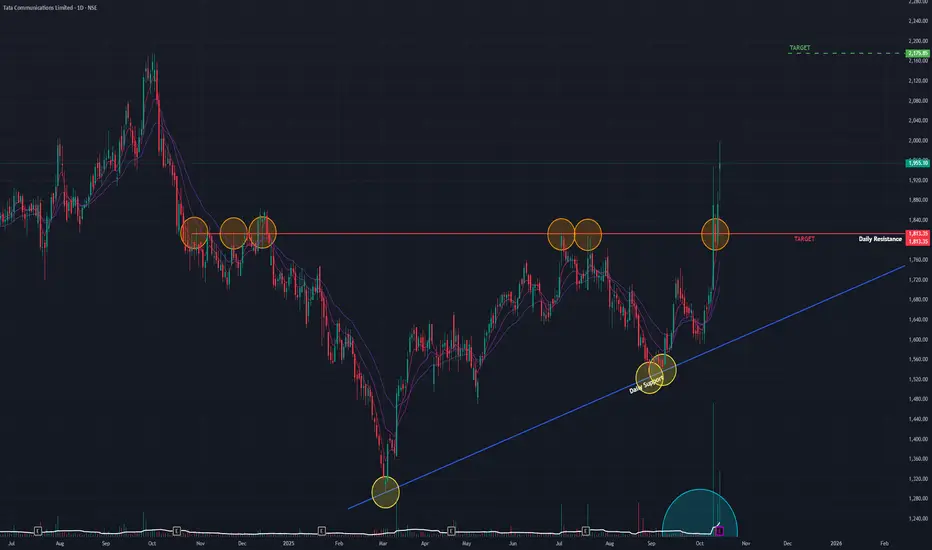
TATA Comm (D) - Breakout Confirmed, But Indecision Pauses RallyTata Communications has completed all the phases of a classic bullish breakout, but today's trading action suggests a brief pause or indecision before a potential new leg up. The overall technical posture remains strong as long as the stock holds above its newly established support.
The Setup: An Ascending Triangle
Following a brief downtrend from its September 2024 All-Time High, the stock began forming a solid base. This took the shape of a classic Ascending Triangle , characterized by a
TATA COMMUNICATIONS - TRADING AT MAJOR SUPPORT ZONESymbol - TATACOMM
CMP - 1388
Tata Communications Ltd. has shown weakness over the past few months, with the overall technical structure indicating a bearish outlook. However, the stock has recently reached a major demand zone, which lies between the 1380-1350 range, a level that has held significant support in previous price actions since 2021. This zone could act as a strong demand area, potentially offering a good trading opportunity at current prices.
The stock has been under selling press
Tata Communication | Breakouts or Fakeouts ? ⭕️ Swing Trading opportunity: Price Action Analysis Alert !!!⭕️
💡✍️Technical Reasons to trade or Strategy applied :-
✅Inverted Head & Shoulder Chart Pattern Bull Breakout
✅Breakout confirmed
✅Rise in Volume
✅Good 3 touches Trendline Breakout with volume
✅Clear uptrend with HH & HLs sequence
✅ Order block as potential Supports
✅Check out my TradingView profile to see how we analyze charts and execute trades.
🙋♀️🙋♂️If you have any questions about this stock, feel free to reach out to me.
📍📌
IDEA | Quick 10% Gain Possible | Investment also Possible ⭕️ Swing Trading opportunity: Price Action Analysis Alert !!!⭕️
💡FNO Stocks Trading📉📈📊
✅Check out my TradingView profile to see how we analyze charts and execute trades.
✅We can't conduct a thorough analysis in such a short span of time. We need to review it, post our findings, and then take action.
🙋♀️🙋♂️If you have any questions about this stock, feel free to reach out to me.
📍📌Thank you for exploring our idea! We hope you found it valuable.
🙏FLLOW for more !
👍LIKE if useful !
✍️COMME
Tata Power & Tata Communications: Dynamic Duo Poised for UpswingTata Power
The stock has shown a significant upward trend, reached at the 460 level, where it encountered strong resistance.
As a result, the price pulled back and found support around the 405 level, entered a consolidation phase.
During this phase, a Pole & Flag pattern developed on the chart, and with a recent breakout supported by robust trading volume, the stock is primed for further upward movement.
Tata Communications
Overall, the price is on an upward trajectory, consistently mak
TATA COMMUNICATIONS - Swing Trade - 9th February #stocksTATA COMMUNICATIONS (1D TF) - Swing Trade Analysis given on 9th Feb, 2024
Pattern: FALLING WEDGE BREAKOUT
- Breakout - Done ✓
- Volume Spike at Resistance - Done ✓
- Retest & Consolidation - In Progress
#stocks #swingtrade #chartanalysis #priceaction #traderyte #TATACOMM #stockmarket #sharemarket #viral #sharemarketindia #StockMarketindia #investment
TATACOMM - Bullish Consolidation with VolumesNSE: TATACOMM is closing with a bullish consolidation candle supported with volumes.
Today's volumes and candlestick formation indicates strong demand and stock should move to previous swing highs in the coming days.
The stock has reversed at key support area which is indicating demand.
One can look for a 18% to 25% gain on deployed capital in this swing trade.
The view is to be discarded in the event of the stock breaking previous swing low.
#NSEindia #Trading #StockMarketindia #Tradingvie
Tata Communication, Target 1420This stock has given a) parallel channel consolidation breakout b) Trendline breakout c) crossed 200EMA and
also continuing to complete d) rounding bottom pattern suggesting nearest target of 1420, provided stock
continues with the momentum to breach immediate resistance levels.
Tata Communictions Falg BreakoutA Bullish flag and Pole breakout has been confirmed with very huge volume on the daily chart of Tata Communications.
Daily & Weekly RSI both are in bullish zone.
One can crete fresh position in Tata Communcations at 1610 or below with a stop loss of Rs. 1510 for a target of Rs, 1910.
The risk to reward ration is 1:3
Exit the position if the stop loss triggered on DCB.
DO YOU WANT ALL MY RESEARCH FOR FREE THEN DON'T FORGET TO FOLLOW ME.
I AM EAGERLY WAITING FOR YOU COMMENTS ON THE STUDY...
Tata Communication - Breakout of consolidation📈 Key Details 📈
Tata Communication is a prominent member of the Tata group, a leading business conglomerate in India with a major presence in telecommunications.
The stock is currently trading at its all-time high levels, indicating strong bullish momentum.
After a consolidation phase lasting over 40 days, the stock has broken out.
📈 Technical Analysis 📈
Tata Communication's chart reveals an exciting trading opportunity. The stock has recently experienced a bullish breakout on the
TATACOMMTATACOMM is displaying a promising flag pattern, indicating a potential bullish move ahead. It would be beneficial to include this stock on your watchlist. I anticipate a favourable upward movement in the near future. It is advisable to set a stop-loss below the swing low, approximately around 1500.
An Analysis in Harmony Top-Down Approach chart studyHello Friends,
Today, we have something special in store as we take a top-down approach to analyze a specific stock - Tata Communications in the world of trading. By employing this multi-time frame method, we'll be diving into various charts, starting from the big picture down to smaller timeframes.
Before we begin, please remember that trading carries risks, and past performance does not guarantee future results. The analysis we're about to discuss is for educational purposes only and not fin
How Does FOUR BREAKOUTS Looks TogetherHere ,
In this Video You Can See , This Particular Stock Has RE-CHECKED on levels to levels .
when all the break-out has came Together , Particular Stock Has Given Huge Breakout .
which was more then 30% Bouncy Returns Over Investment .
Technical Analysis Helps You to Learn Those Moves ,
its not something predicting future , but Definitely It Can Show You an Path .
Bullish Run in Tata Communications Ltd. An Investor's Delighthowdy Traders,
Much of the power of bullish investors is found in Tata Communications.
If seen inside the chart, higher high and lower low is shown in parallel channels.
1429 level was a strong resistance level but now it is a support.
If the market sustains above the 1429 level then a bullish market can be seen and 1480 is the target.
#Tata Communication will hold BO or not!Stock has given BO after multiple rejection from resistance zone with good volume spike, follow chart for proper entry and exit levels.
TLong
TATA COMMThe stock is at a perfect level to buy, The volumes at the support level are very high, if the stock sustains this bulls can run for a long time.
I am waiting for stock to test 1200 levels again to buy.
People in FOMO can add few quantities at this level. and add more quantities when needed to average.
Dont hold the stock below the trendline