TCS testing resistance with low volumesBased on TCS earnings, there was an up-move with volumes. Currently, the price is near resistance. However, the rejection volume is not high. So keep a watch on this for further up move
Note: I am not a registered SEBI member. Hence, please do not take this as an investment advice. This is just for education purposes only.
Tataconsultancyservices
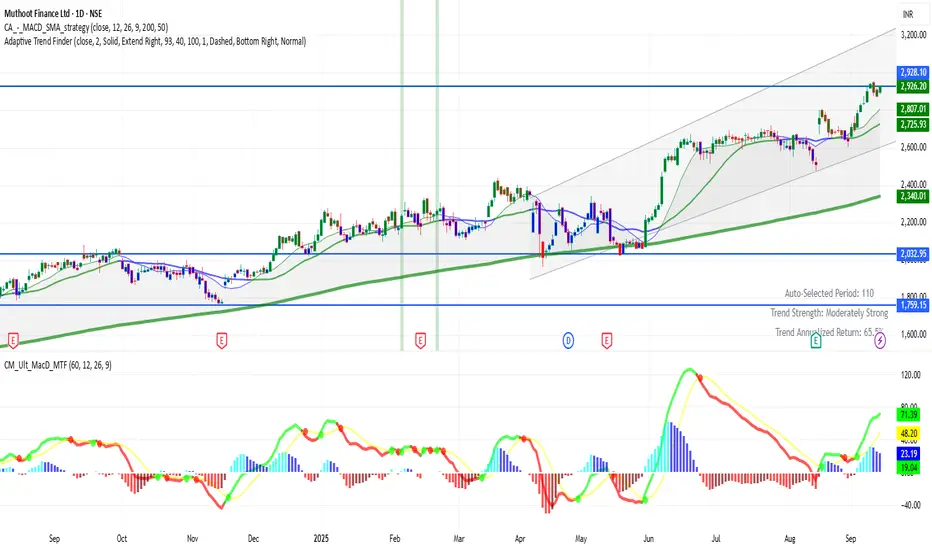
MUTHOOTFIN 1D Time framePrice is about ₹2,926
It's near its 52-week high region.
Price is trading well above most of its longer moving averages (50-day, 100-day, 200-day).
Bullish Scenario
Holding above ~ ₹2,900 is key. If that holds and price pushes past ~ ₹3,000, there’s potential to move up toward ~ ₹3,100-₹3,150.
Strength in broader market & favorable sector sentiment (gold prices, NBFC performance) would help.
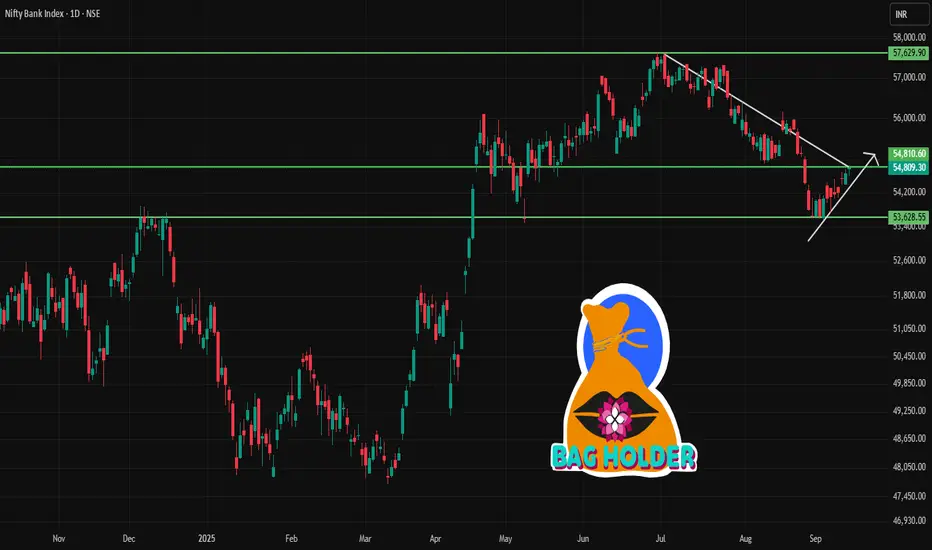
BANKNIFTY 1D Time frame📉 Current Market Snapshot
Closing Price: ₹54,809.30
Day's Range: ₹54,580.35 – ₹54,852.25
52-Week Range: ₹47,702.90 – ₹57,628.40
Market Cap: ₹45,50,788 crore
P/E Ratio: 14.9
Dividend Yield: 1.09%
Price-to-Book Ratio: 2.03
1-Year Return: +5.87%
5-Year Return: +147.36%
10-Year Return: +12.5%
BAJFINANCE 1D Time frame📉 Current Market Snapshot
Current Price: ₹1,003.25
Previous Close: ₹970.25
Day's Range: ₹970.85 – ₹1,004.60
52-Week High: ₹1,004.60
52-Week Low: ₹645.10
Market Cap: ₹6,24,270 crore
P/E Ratio: 35.8
Book Value: ₹156
Dividend Yield: 0.44%
ROE: 19.2%
Debt-to-Equity Ratio: 3.74
Beta: 1.01
EPS (TTM): ₹28.00
Face Value: ₹1.00
TCS Mid Term SwingBollinger burst , and price is going along side 3rd
deviation, our special indicator also showing break
out in day chart and it never misses trades.
it may try to retrace from current high but will take
support in short support and go long above 3558,
target-3823.
target above 3558 is 7.5% , SL will be 2.5 %.
TCS can be bought ABOVE 3327TCS seems to continue on its previous trend. Can be bought in Cash market around 3327 with Stop loss of 3235 and a target of 3603
FOR EDUCATIONAL AND INFORMATIONAL PURPOSES ONLY
The information posted are for educational and informational purposes only. These are trade which are taken by me personally along with money management. However, under no circumstances, or no word written on this post suggests or makes me liable for any trade which the visitor makes based on the information provided o
Simple Trade Setup | TCS | 13-04-2022 [INTRADAY]NSE:TCS
Observations:
1) On 1day time frame, we can see 3645 is immediate major support level.
And 3680-3700 is no trade zone. Above this zone it will be bullish and below this it will be bearish till 3645.
Breakdown of 3645 will lead it to more bearish.
Please refer below chart : 1day time frame.
2) On 1hr time frame, it is forming head and shoulder pattern, which is a bearish pattern.
Neckline we can consider at 3645 level only.
If this pattern gets active then we can see fa
Simple Trade Setup | TCS | 27-12-2021 [INTRADAY]NSE:TCS
All the levels and trade setup will be same as per previous.
Trade Setup for Date: 27-12-2021
1) Don't Jump in to trade at the beginning of the market. Let it get settle for 15-20min first and judge the price action.
2) Everything is mentioned on the chart. I hope it is easy to understand.
3) All the levels will work as support, resistance, entry and exit w.r.t price action near that level.
4) Avoid gap up or gap down chase. Wait and trade between levels.
Please refer below