TIINDIA Technical Analysis|Ascending Triangle Breakout Explained📊 TIINDIA Trade Analysis
🔎 Price Action
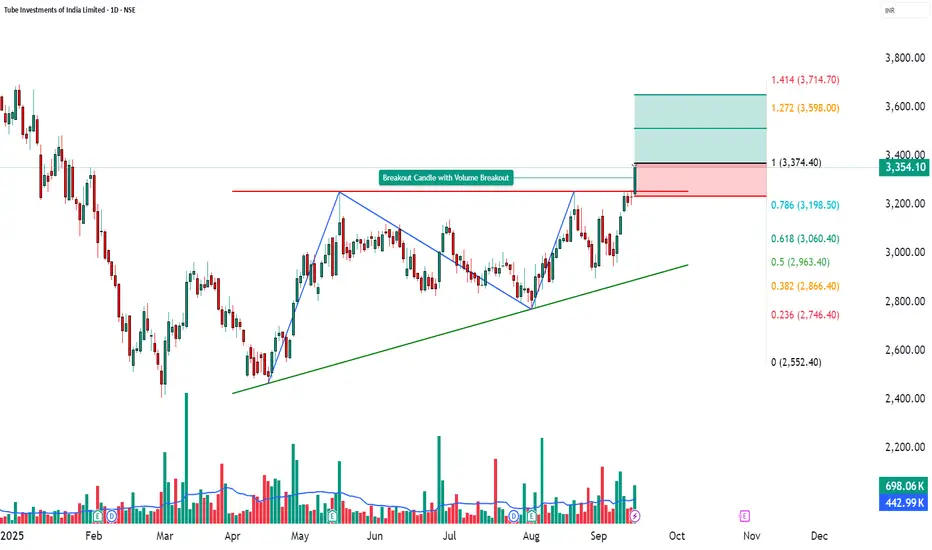
TIINDIA closed at ₹3354.1 with a strong +3.8% gain, backed by a volume of 6.98 lakh, which is well above its 20-day average volume of 4.43 lakh (VolX = 1.26x).
This surge confirms strong buyer participation, supporting bullish momentum and indicating sustained strength in the uptrend.
________________________________________
📉 Chart Signals: Ascending Triangle Pattern
Strong bullish breakout candle with heavy volumes.
RSI breakout confirming underlying st
 Long