Outlook Cycles and the Importance of Cycle Analysis in TradingIntroduction to Outlook Cycles
Trading in financial markets is as much an art as it is a science. Among the tools that experienced traders use to anticipate market movements, outlook cycles play a critical role. An outlook cycle refers to the recurring patterns or phases in the market that repeat over time. These cycles are not arbitrary; they emerge from the collective psychology of market participants, macroeconomic trends, corporate earnings patterns, and broader financial and geopolitical influences.
Understanding these cycles allows traders to anticipate potential market turning points and adjust their strategies accordingly. While cycles do not guarantee exact price movements, they provide a probabilistic framework for predicting trends and reversals, making them invaluable for strategic planning in trading.
Defining Outlook Cycles
An outlook cycle in trading can be described as a repetitive sequence of market behavior, typically measured in time units such as days, weeks, months, or even years. These cycles can manifest across various financial instruments including stocks, commodities, currencies, and indices.
Key Features of Outlook Cycles
Repetition: Patterns tend to recur in similar forms over time.
Predictability: While not exact, they provide insight into probable future movements.
Duration: Cycles can be short-term (intra-day to weekly) or long-term (monthly, quarterly, yearly).
Amplitude: Cycles vary in magnitude, influencing how strongly price moves during different phases.
Types of Outlook Cycles
Outlook cycles can be categorized based on their duration and underlying factors:
Short-term cycles:
Usually last from a few hours to a few weeks.
Influenced by market sentiment, news, technical setups, and trader behavior.
Example: Stock price oscillations around support and resistance levels.
Intermediate cycles:
Typically span several weeks to months.
Influenced by quarterly earnings, monetary policy announcements, and macroeconomic indicators.
Example: Seasonal patterns in commodities or consumer stocks during festive periods.
Long-term cycles:
Extend from several months to multiple years.
Driven by fundamental shifts such as economic expansions or recessions, geopolitical events, or major technological disruptions.
Example: Bull and bear market cycles in equities or long-term commodity demand cycles.
Importance of Cycle Analysis in Trading
Cycle analysis is a crucial aspect of trading because it enables traders to anticipate market movements rather than react to them. Here are the key reasons why cycle analysis is vital:
1. Identifying Market Phases
Every market moves in phases: accumulation, uptrend, distribution, and downtrend.
Accumulation Phase: In this phase, smart money often accumulates positions quietly. Price moves are subtle but set the stage for the next upward move.
Uptrend Phase: Characterized by increasing prices, often driven by retail participation and positive sentiment.
Distribution Phase: Large investors start taking profits, leading to sideways or slightly downward movement.
Downtrend Phase: Prices decline as panic selling and negative sentiment dominate.
Cycle analysis helps traders identify these phases in advance, providing an edge in entering or exiting trades.
2. Timing Entries and Exits
By studying cycles, traders can refine their entry and exit points, rather than relying solely on price action or technical indicators. For instance:
Buying near the beginning of an uptrend cycle maximizes profit potential.
Selling or shorting near the peak of a cycle helps avoid losses during downturns.
This timing advantage is particularly critical in volatile markets where even a few days of misjudgment can result in significant losses.
3. Managing Risk
Cycle analysis allows traders to implement risk management strategies based on the stage of the market cycle. For example:
During a downward cycle, traders may reduce position size or hedge portfolios using options or inverse ETFs.
During upward cycles, traders may take on higher risk positions to capitalize on strong trends.
Understanding cycles provides a risk-reward framework rather than trading blindly.
4. Enhancing Strategy Development
Traders often combine cycle analysis with other methods like technical indicators, fundamentals, and sentiment analysis to create robust trading strategies.
Example: Using moving averages or Fibonacci retracements in conjunction with cycle peaks and troughs can improve accuracy.
Example: Combining economic data releases with known seasonal cycles in commodities (like oil or agricultural products) enhances decision-making.
5. Psychological Advantage
Markets are driven by human behavior, which is inherently cyclical. Fear, greed, optimism, and panic repeat across generations of investors. By recognizing these recurring emotional patterns, traders gain a psychological advantage over the average participant who trades impulsively.
6. Recognizing External Influences
Outlook cycles also help traders understand how external factors influence markets, such as:
Central bank policies affecting interest rates and liquidity.
Geopolitical tensions causing volatility in commodities like oil and gold.
Seasonal economic trends, such as holiday shopping periods boosting retail stocks.
By correlating cycles with external events, traders can anticipate market reactions rather than merely respond after the fact.
Practical Applications of Cycle Analysis
Stock Market Trading:
Identifying earnings cycles, dividend announcements, and market sentiment peaks.
Recognizing seasonal patterns, e.g., “Sell in May and go away” trend in equities.
Forex Trading:
Analyzing interest rate cycles, central bank policy cycles, and currency correlations.
Predicting trends based on geopolitical events affecting specific currencies.
Commodity Trading:
Tracking seasonal demand-supply cycles, such as oil demand in summer or agricultural harvesting cycles.
Understanding macroeconomic cycles like inflationary pressures influencing precious metals.
Options and Derivatives Trading:
Identifying implied volatility cycles to time option purchases or sales.
Understanding cyclical patterns in futures markets for hedging and speculative purposes.
Tools for Cycle Analysis
Several tools and techniques help traders analyze market cycles:
Technical Indicators:
Moving Averages, MACD, RSI, and Stochastic oscillators can identify cyclical peaks and troughs.
Elliott Wave Theory:
Recognizes repeating patterns in market psychology and price action.
Useful in identifying primary, intermediate, and minor cycles.
Fourier and Spectral Analysis:
Advanced methods that break down price data into component cycles to detect periodicity.
Seasonal Charts and Historical Analysis:
Compare current market conditions with historical trends to anticipate recurring patterns.
Economic Calendars and Fundamental Analysis:
Aligning macroeconomic cycles with market cycles enhances predictive accuracy.
Challenges in Cycle Analysis
While outlook cycles provide significant insight, traders must be aware of certain limitations:
No Guarantee of Accuracy:
Cycles indicate probability, not certainty. External shocks can disrupt patterns unexpectedly.
Multiple Overlapping Cycles:
Short-term, intermediate, and long-term cycles can interact, sometimes creating conflicting signals.
Complex Interpretation:
Reading cycles requires experience and often involves combining multiple analytical techniques.
Dynamic Market Conditions:
Cycles can shift over time due to changes in market structure, regulations, or participant behavior.
Despite these challenges, skilled traders view cycles as guiding tools, not absolute rules.
Conclusion
Outlook cycles are a cornerstone of informed trading, offering a structured approach to understanding market dynamics. By analyzing cyclical patterns, traders can anticipate market phases, time entries and exits, manage risk, and gain a psychological edge. Whether in stocks, commodities, forex, or derivatives, cycle analysis complements technical and fundamental methods, creating a more holistic and strategic trading approach.
While cycles are not infallible, they provide a probabilistic framework for decision-making in uncertain markets. Traders who master cycle analysis can move from reactive trading to proactive, calculated strategies, enhancing their potential for consistent profitability.
In short, understanding outlook cycles transforms market uncertainty into strategic opportunity, making cycle analysis one of the most valuable tools in a trader’s toolkit.
Tradingforex
What Makes Crypto Different from Traditional AssetsIntroduction
Cryptocurrencies have emerged over the last decade as a revolutionary form of digital asset, capturing global attention for their potential to redefine finance, investment, and even societal trust. Unlike traditional assets such as stocks, bonds, and fiat currencies, crypto operates on decentralized networks and utilizes cryptographic principles. While traditional assets have been the cornerstone of financial markets for centuries, crypto introduces novel features and risks that set it apart. Understanding these differences is crucial for investors, policymakers, and anyone interested in the evolution of financial markets.
1. Nature of the Asset
Traditional Assets: Traditional financial assets represent ownership in a tangible or legal entity. For example, stocks signify a share of ownership in a company, bonds are debt instruments promising future repayment, and real estate represents physical property. Their value is often tied to cash flows, earnings, or physical utility.
Cryptocurrencies: Cryptocurrencies are purely digital assets, existing only on a blockchain—a distributed ledger maintained by a network of computers. They do not inherently represent ownership of a company or tangible goods (except for certain tokenized assets). Their value derives from scarcity (like Bitcoin’s capped supply), network adoption, and market sentiment rather than conventional cash flows.
Key Difference: Crypto is an intangible, digital-only asset whose value is largely determined by market perception, adoption, and underlying blockchain technology, unlike traditional assets which are tied to tangible ownership or income streams.
2. Decentralization and Control
Traditional Assets: Traditional assets are regulated and controlled by central authorities such as governments, central banks, and regulatory bodies. For instance, stock markets operate under oversight from institutions like the SEC in the United States. Transactions are intermediated by banks, brokers, and clearinghouses, ensuring compliance with legal frameworks.
Cryptocurrencies: Most cryptocurrencies operate on decentralized networks, meaning no single entity controls the system. Transactions are verified by a distributed network of nodes using consensus mechanisms such as proof-of-work or proof-of-stake. Users can transact peer-to-peer without intermediaries, reducing reliance on centralized authorities.
Key Difference: Crypto offers decentralization and autonomy, whereas traditional assets rely heavily on centralized intermediaries for governance and transaction verification.
3. Supply and Inflation Mechanisms
Traditional Assets: Fiat currencies are subject to monetary policy, with central banks controlling supply to influence inflation, interest rates, and economic growth. Stocks are issued at the discretion of companies, and bonds follow government or corporate debt issuance schedules. The supply can be increased or adjusted according to policy or corporate strategy.
Cryptocurrencies: Cryptos like Bitcoin have fixed supplies encoded in their protocols (Bitcoin’s maximum supply is 21 million coins). Other cryptocurrencies use algorithms to control issuance and incentivize network participation. This scarcity is designed to emulate deflationary characteristics, contrasting with the often inflationary nature of fiat currencies.
Key Difference: Crypto supply is usually pre-determined and algorithmically enforced, whereas traditional assets are subject to discretionary management and central control.
4. Liquidity and Market Accessibility
Traditional Assets: Stocks and bonds are traded on regulated exchanges with established liquidity and market hours. Investors often require brokerage accounts, and trading may be limited by jurisdictional regulations. While liquidity is generally high for large-cap assets, small markets may suffer from limited participants.
Cryptocurrencies: Crypto markets operate 24/7 globally with virtually no geographic restrictions. Anyone with internet access can buy, sell, or hold crypto, often without the need for traditional intermediaries. However, liquidity can vary widely between coins; while Bitcoin and Ethereum are highly liquid, smaller tokens may be subject to high volatility and thin markets.
Key Difference: Crypto markets are continuously accessible and globally decentralized, unlike traditional markets with operational hours and regional constraints.
5. Volatility and Risk Profile
Traditional Assets: Traditional assets tend to have established risk-return profiles. While stocks can be volatile, especially in emerging sectors, they are generally less erratic compared to crypto. Bonds provide predictable returns with lower volatility, and commodities fluctuate based on supply-demand fundamentals.
Cryptocurrencies: Cryptos are highly volatile. Prices can swing 10–20% in a single day due to market sentiment, regulatory news, or technical developments. While volatility offers opportunities for high returns, it also carries substantial risk. Crypto markets are less mature and less predictable than traditional markets.
Key Difference: Crypto’s extreme volatility distinguishes it as a high-risk, high-reward asset class, unlike the relatively stable behavior of traditional financial assets.
6. Regulation and Legal Framework
Traditional Assets: Traditional financial assets operate under well-established legal frameworks and are protected by investor safeguards. Securities laws, accounting standards, and regulatory oversight aim to reduce fraud and systemic risk.
Cryptocurrencies: Crypto regulation is still evolving. Some countries have embraced it, creating frameworks for trading, taxation, and custody, while others ban or restrict usage. Lack of regulation can lead to fraud, hacking, and market manipulation. Investor protections are often minimal compared to traditional markets.
Key Difference: Traditional assets are highly regulated with legal recourse for investors, whereas crypto operates in a more ambiguous and evolving regulatory environment.
7. Transparency and Verification
Traditional Assets: Transparency in traditional assets is often limited to financial reporting, audits, and regulatory filings. Verification of ownership or transactions usually requires intermediaries like banks or clearinghouses.
Cryptocurrencies: Blockchains provide public, immutable ledgers where anyone can verify transactions without intermediaries. Smart contracts enable automatic execution of agreements. This transparency reduces the need for trust in centralized authorities but requires understanding of blockchain technology.
Key Difference: Crypto enables direct, verifiable transparency of transactions, while traditional assets rely on intermediaries for reporting and verification.
8. Divisibility and Portability
Traditional Assets: While fiat currencies are divisible and easily transferable, assets like real estate or certain bonds are not easily fractioned or transferred. Stocks can be subdivided through shares, but some physical assets remain illiquid or cumbersome.
Cryptocurrencies: Cryptos are highly divisible; for example, Bitcoin can be split into 100 million units called satoshis. Digital nature makes them extremely portable and transferrable across borders instantly with minimal fees compared to traditional banking systems.
Key Difference: Cryptos offer unmatched divisibility and portability, enhancing flexibility for small and large investors alike.
9. Innovation and Utility
Traditional Assets: The utility of traditional assets is relatively straightforward—stocks provide ownership, bonds offer interest, and commodities have industrial or consumption uses. Innovation in traditional finance occurs, but structural changes are slow due to regulatory and institutional constraints.
Cryptocurrencies: Cryptos are more than just assets; they enable decentralized finance (DeFi), tokenization, programmable money, and novel applications like NFTs. They offer utility within their ecosystems, such as participating in governance, staking, and decentralized applications.
Key Difference: Cryptos combine financial value with technological utility, whereas traditional assets primarily serve as stores of value or income generation tools.
10. Security and Custody
Traditional Assets: Security in traditional finance depends on trusted intermediaries—banks, brokers, and clearinghouses. Physical assets can be insured, and digital assets in broker accounts are protected by legal frameworks.
Cryptocurrencies: Crypto security is decentralized but relies heavily on private key management. Loss of keys can mean permanent loss of funds. While blockchain is secure by design, exchanges and wallets have been hacked, emphasizing the importance of personal custody practices.
Key Difference: Crypto security shifts responsibility to the individual, unlike traditional assets where intermediaries shoulder the protection burden.
11. Global Accessibility and Inclusivity
Traditional Assets: Access to traditional assets often requires citizenship, residency, or local bank accounts. Emerging markets may face barriers due to infrastructure limitations or regulatory constraints.
Cryptocurrencies: Crypto allows anyone with internet access to participate in global markets. It can provide financial inclusion to unbanked populations, bypassing traditional barriers.
Key Difference: Cryptos are inherently borderless and democratizing, while traditional assets are constrained by geography and regulatory frameworks.
Conclusion
Cryptocurrencies fundamentally differ from traditional assets across multiple dimensions: nature, control, supply mechanisms, liquidity, risk, regulation, transparency, divisibility, innovation, security, and accessibility. Traditional assets are backed by tangible entities or cash flows, regulated by authorities, and generally stable, while crypto thrives on decentralization, digital scarcity, and technological innovation.
These differences create opportunities and challenges. On one hand, crypto democratizes finance, allows for 24/7 global markets, and enables programmable financial tools. On the other hand, it introduces high volatility, regulatory uncertainty, and security risks. As the financial landscape evolves, understanding these distinctions is critical for investors, regulators, and innovators aiming to navigate both traditional and digital asset ecosystems.
Cryptocurrency is not merely an alternative investment; it represents a paradigm shift in how value, trust, and financial transactions are conceived. While traditional assets remain foundational to wealth creation, crypto pushes the boundaries of what constitutes money, ownership, and economic participation in the 21st century.
Part 12 Trading Master Class With Experts Common Option Trading Strategies
Options can be combined in different ways to create strategies with defined risk and reward profiles.
Some popular strategies include:
Covered Call – Holding a stock and selling a call option on it (income strategy).
Protective Put – Holding a stock and buying a put to protect downside risk.
Straddle – Buying both call and put at the same strike to profit from big moves.
Strangle – Similar to a straddle, but strikes are different.
Iron Condor – Selling both a call and a put spread to profit from a sideways market.

Part 11 Trading Master Class With Experts Option Greeks
Option prices are influenced by several factors, measured through the Greeks:
Delta: Measures how much the option price changes with a ₹1 move in the underlying.
Gamma: Measures how Delta changes as the underlying price changes.
Theta: Measures time decay (how the option loses value daily).
Vega: Measures sensitivity to volatility changes.
Rho: Measures sensitivity to interest rate changes.
Traders use these Greeks to manage risk and plan strategies.

Divergence Secrets Option Premium Components
The option premium (price) has two parts:
Intrinsic Value: The actual value if exercised now (difference between stock price and strike price).
Time Value: The extra amount traders pay for the potential of future movement before expiry.
As expiry approaches, time value decreases, a phenomenon known as time decay (Theta).

Part 2 Support and Resistance Why Traders Use Options
Options are versatile instruments. Traders use them for:
Speculation – Betting on price movement to earn profits.
Hedging – Protecting existing investments from adverse price moves.
Income Generation – Selling options (writing) to earn the premium.
For example:
A trader may buy a call option expecting prices to rise.
A portfolio manager may buy put options to protect their stocks from falling prices.
An experienced investor may sell covered calls to earn regular income.

Part 1 Support and Resistance How Option Trading Works
Let’s take a simple example:
You buy a Call Option for Reliance Industries with a strike price of ₹2,400, expiring in one month.
The premium is ₹50 per share, and the lot size is 250 shares.
So, your cost = ₹50 × 250 = ₹12,500.
If the stock price rises to ₹2,500 before expiry, your option becomes profitable.
You can either exercise your right to buy at ₹2,400 (and immediately sell at ₹2,500), or you can sell the option itself in the market for a profit.
If the stock stays below ₹2,400, your option will expire worthless, and your loss will be limited to the premium paid (₹12,500).

PCR Trading Strategies Introduction to Option Trading
Option trading is a segment of the financial market where traders buy and sell contracts that give them the right—but not the obligation—to buy or sell an asset at a predetermined price within a specific time period. These contracts are known as options. Unlike stocks or commodities, where traders own the underlying asset directly, options allow traders to speculate on price movements, hedge risks, or leverage their investments.

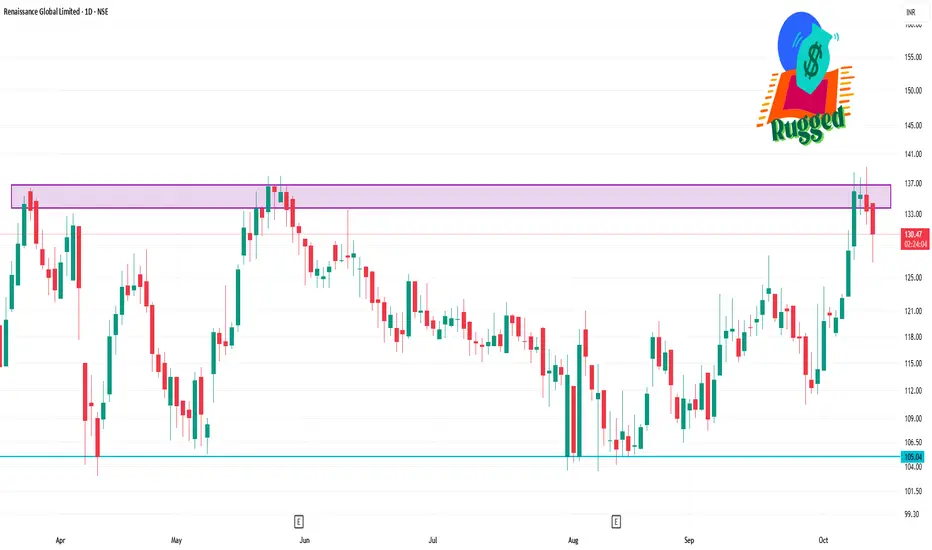
RGL 1 Day Time Frame📊 Intraday Price Movement
Opening Price: ₹135.00
Day's Range: ₹131.60 – ₹139.21
Previous Close: ₹135.46
Volume Traded: Approximately 711,000 shares
Market Cap: ₹1,453.32 crore
🔧 Technical Indicators
Relative Strength Index (RSI): 72.25, indicating potential overbought conditions
Moving Average Convergence Divergence (MACD): 0.82, suggesting a bullish trend.
Support Levels: ₹130.00 and ₹131.60
Resistance Levels: ₹135.46 and ₹139.21
📈 52-Week Range
High: ₹207.40
Low: ₹103.01
ITC 1 Day Time Frame📊 Key Support & Resistance Levels
Support Levels: ₹398.30, ₹399.25, ₹397
Resistance Levels: ₹401, ₹402, ₹403
The stock is currently near the support zone, indicating potential for a short-term rebound if buying pressure increases.
📈 Pivot Points (Classic Method)
Pivot Point: ₹399.58
Resistance Levels: R1: ₹400.62, R2: ₹401.98, R3: ₹403.02
Support Levels: S1: ₹398.22, S2: ₹397.18, S3: ₹395.82
Trading below the pivot point suggests a bearish bias.

CROMPTON 1 Week Time Frame 📉 1-Week Technical Outlook
Trend: The stock is currently in a "Strong Sell" position based on moving averages and other technical indicators, with 0 buy signals and 12 sell signals.
Relative Strength Index (RSI): The 14-day RSI stands at 28.72, indicating that the stock is in oversold territory.
Moving Averages:
5-day: ₹282.01
50-day: ₹287.02
200-day: ₹305.51
All moving averages suggest a bearish trend.
🔧 Key Support and Resistance Levels
Immediate Support: ₹281.32
Major Support: ₹274.88
Immediate Resistance: ₹296.02
Major Resistance: ₹304.28
A breakdown below ₹281.32 could lead to further declines, while a breakout above ₹296.02 may signal a reversal.

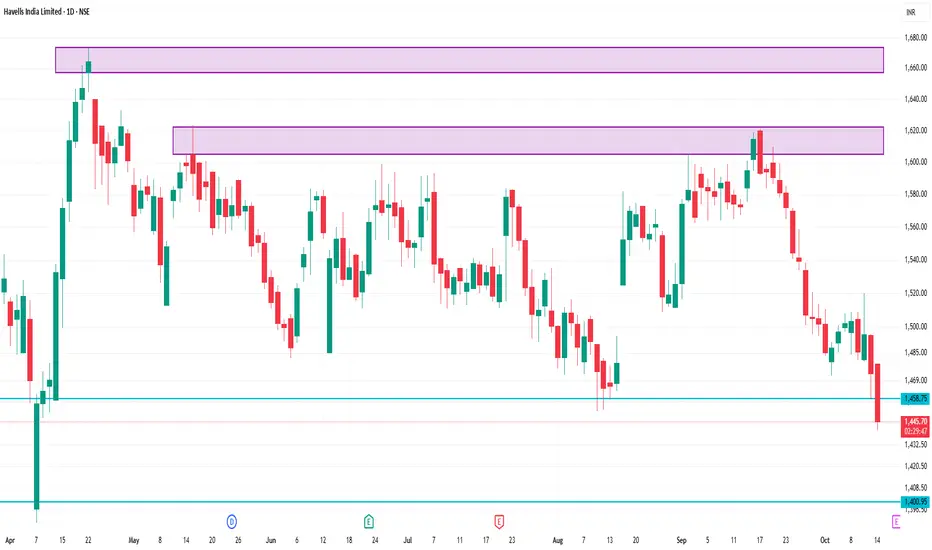
HAVELLS 1 Day Time Frame 📊 Key Support and Resistance Levels
Immediate Support: ₹1,477.53
Immediate Resistance: ₹1,527.85
Short-Term Support: ₹1,497.04
Short-Term Resistance: ₹1,538.60
Fibonacci Pivot Point: ₹1,462.70
These levels are derived from standard technical analysis tools and are relevant for intraday trading strategies.
📉 Technical Indicators
Relative Strength Index (RSI): 28.62 (indicating an oversold condition)
Moving Average Convergence Divergence (MACD): -9.64 (suggesting bearish momentum)
5-Day Moving Average: ₹1,465.36
50-Day Moving Average: ₹1,490.21
200-Day Moving Average: ₹1,547.08
These indicators collectively suggest a bearish trend in the short term.
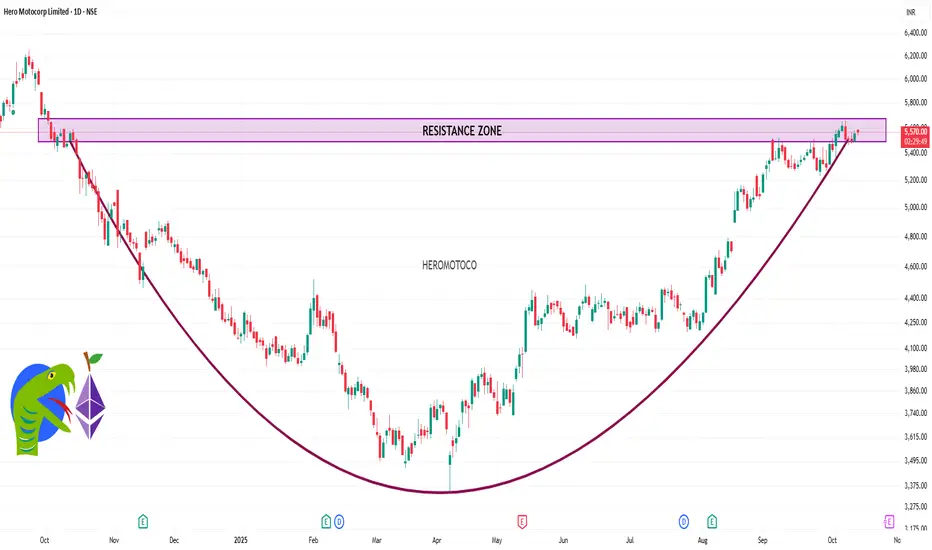
HEROMOTOCO 1 Day Time Frame 📈 Current Price and Technical Overview
Current Price: ₹5,547.50
Day's Range: ₹5,540.00 – ₹5,591.00
52-Week Range: ₹3,344.00 – ₹5,659.00
Volume: 181,480 shares
VWAP: ₹5,561.87
Market Cap: ₹111,208 crore
🔍 Technical Indicator
RSI (14-day): 53.69 — Neutral
MACD: 4.05 — Buy Signal
CCI: 92.51 — Buy Signal
ADX: 28.12 — Buy Signal
ATR (14-day): ₹35.14 — Indicates lower volatility
📊 Moving Averages
5-day EMA: ₹5,443.40 — Buy Signal
20-day EMA: ₹5,547.67 — Buy Signal
50-day EMA: ₹5,521.93 — Buy Signal
100-day EMA: ₹5,484.48 — Buy Signal
200-day EMA: ₹5,350.33 — Buy Signal
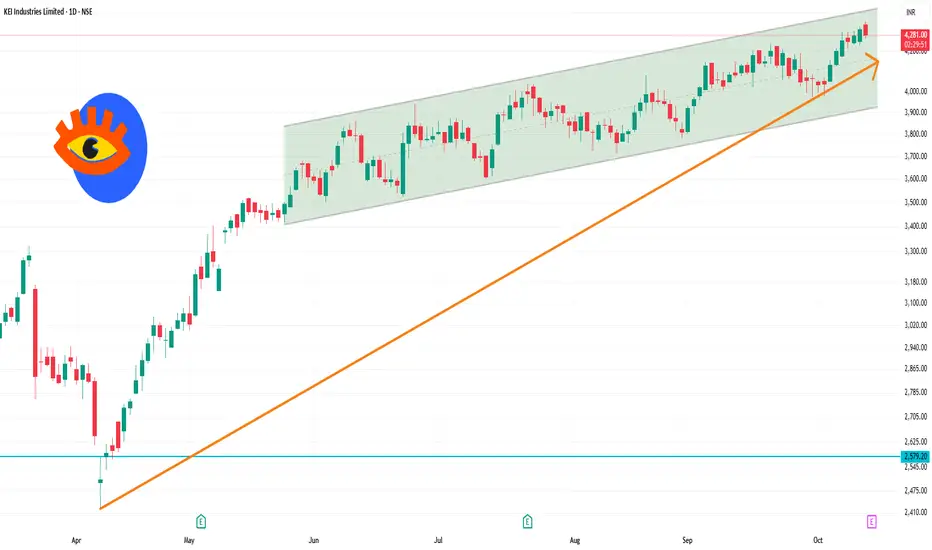
KEI 1 Day Time Frame 📊 Key Intraday Pivot Levels (Classic, Fibonacci, Camarilla)
Based on the previous day's price range, here are the calculated support and resistance levels:
Classic Pivot Points:
Pivot (P): ₹4,287.97
Resistance Levels:
R1: ₹4,348.63
R2: ₹4,385.67
R3: ₹4,446.33
Support Levels:
S1: ₹4,250.93
S2: ₹4,190.27
S3: ₹4,153.23
Fibonacci Levels:
Pivot (P): ₹4,287.97
Resistance Levels:
R1: ₹4,325.29
R2: ₹4,348.35
R3: ₹4,385.67
Support Levels:
S1: ₹4,250.65
S2: ₹4,227.59
S3: ₹4,190.27
Camarilla Levels:
Pivot (P): ₹4,287.97
Resistance Levels:
R1: ₹4,320.56
R2: ₹4,329.51
R3: ₹4,338.47
Support Levels:
S1: ₹4,302.64
S2: ₹4,293.69
S3: ₹4,284.73
These levels are derived from the previous day's high, low, and close prices and are widely used for intraday trading decisions.
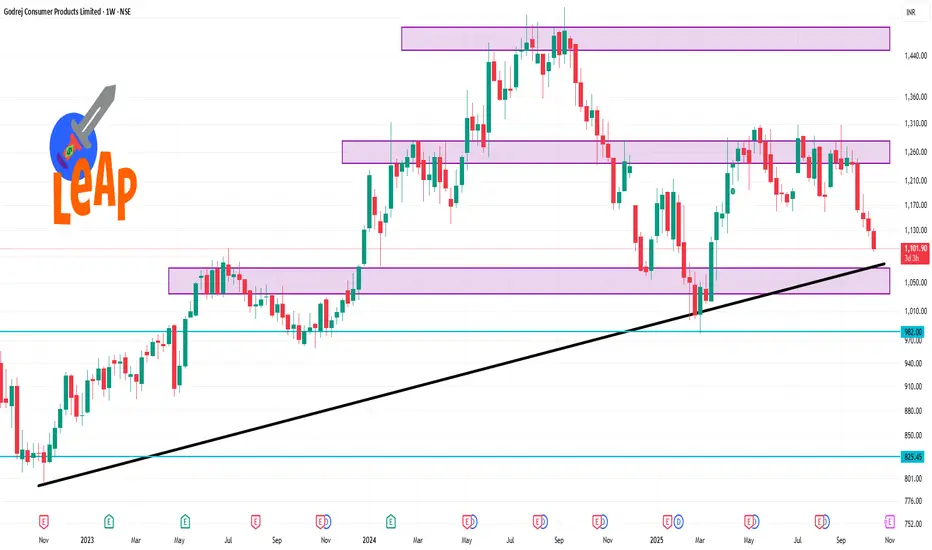
GODREJCP 1 Week Time Frame 📊 Weekly Support and Resistance Levels
Immediate Support: ₹1,112.83
Major Support: ₹1,095.87
Immediate Resistance: ₹1,153.93
Major Resistance: ₹1,178.07
Upper Range for the Week: ₹1,195.03
Lower Range for the Week: ₹1,071.73
📈 Technical Outlook
Trend: Bearish
RSI (14-day): 22.61 — indicating an oversold condition
MACD: -8.17 — suggesting a bearish trend
Moving Averages: All key moving averages (5-day to 200-day) are in a strong sell position, with no buy signals.
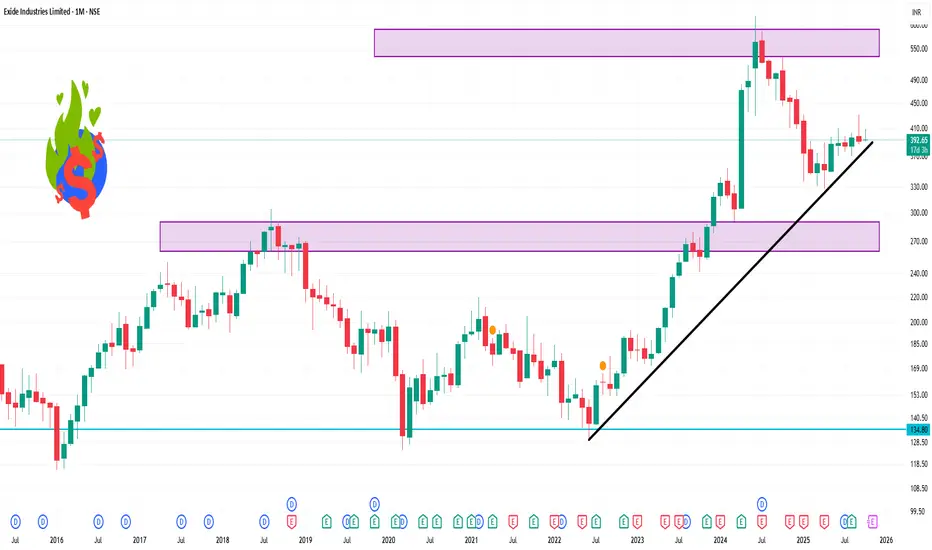
EXIDEIND 1 Month Time Frame 📊 1-Month Technical Overview
Price Performance:
Current Price: ₹393.15
1-Month Change: -5.73%
52-Week Range: ₹328.00 – ₹534.40
Technical Indicators:
RSI (14): 49.30 — Neutral
MACD: -1.72 — Buy Signal
ADX (14): 18.63 — Weak Trend
Pivot Points: Support at ₹385.58; Resistance at ₹409.28
Moving Averages:
5-Day EMA: ₹399.86 — Buy
20-Day EMA: ₹401.20 — Sell
50-Day EMA: ₹399.24 — Buy
100-Day EMA: ₹395.07 — Buy
200-Day EMA: ₹396.66 — Buy
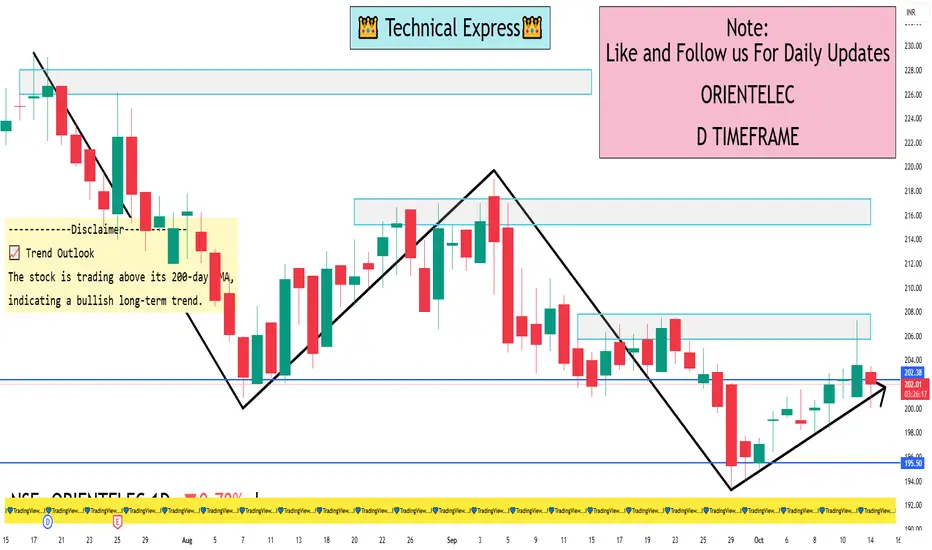
ORIENTELEC 1 Day View 📊 Intraday Support & Resistance Levels
Support Levels:
₹201.10
₹199.70
₹198.60
Resistance Levels:
₹203.50
₹204.70
₹206.00
These levels are derived from recent price action and pivot point analysis.
🔍 Technical Indicators
Relative Strength Index (RSI): 62.39 — indicates a bullish momentum without being overbought.
Moving Averages: The stock is above its 200-day exponential moving average (EMA), suggesting a positive long-term trend.
MACD: Neutral at 0.000, implying no strong directional momentum.
🔁 Pivot Points (Daily)
Central Pivot Point: ₹202.18
Resistance: ₹203.54 (R1), ₹204.65 (R2), ₹206.01 (R3)
Support: ₹201.07 (S1), ₹199.71 (S2), ₹198.60 (S3)
These levels are based on standard pivot point calculations and can help identify potential reversal zones.
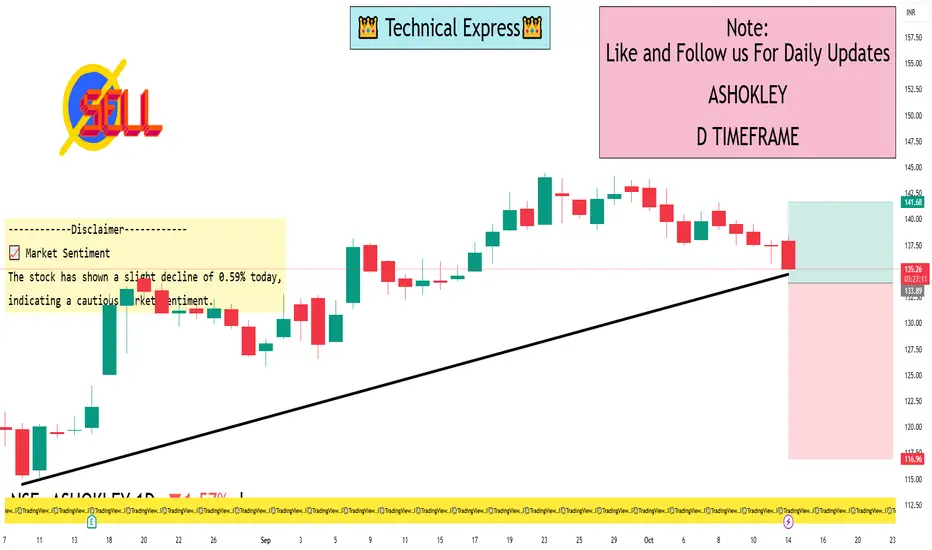
ASHOKLEY 1 Day View 📊 Intraday Support & Resistance Levels
Based on recent technical analysis, the key intraday levels for ASHOKLEY are:
Support Levels: ₹135.86, ₹137.53
Resistance Levels: ₹139.32, ₹141.61
The stock is currently near its support zone, which may present a buying opportunity if it holds above ₹137.53. A break below ₹135.86 could lead to further downside.
📉 Technical Indicators
RSI (14): 40.08, indicating neutral momentum.
MACD: -0.45, suggesting mild bearishness.
Moving Averages: Trading below the 5-day, 50-day, and 200-day moving averages, reinforcing the bearish sentiment.
📈 Market Sentiment
The stock has shown a slight decline of 0.59% today, indicating a cautious market sentiment.
Introduction and Types of Financial Markets1. Introduction to Financial Markets
A financial market is a marketplace where buyers and sellers engage in trading financial assets such as stocks, bonds, currencies, and derivatives. These markets play a crucial role in the financial system by ensuring the allocation of resources, facilitating liquidity, and enabling price discovery.
1.1 Definition
Financial markets can be defined as structured systems through which financial instruments are issued, bought, sold, or exchanged. These instruments represent claims on real assets or future income and include equities, debt instruments, currencies, and derivatives.
Key definitions:
Investopedia: "A financial market is any marketplace where trading of securities occurs, including the stock market, bond market, forex market, and derivatives markets."
Mishkin and Eakins: "Financial markets are markets where funds are transferred from savers to borrowers."
1.2 Importance of Financial Markets
Financial markets serve as a backbone for economic growth. Some of their major functions include:
Capital Formation: Financial markets channel funds from savers to investors, facilitating business expansion and economic development.
Liquidity: Investors can quickly buy or sell financial instruments, ensuring access to cash when needed.
Price Discovery: Financial markets determine the price of assets based on supply and demand dynamics.
Risk Management: Markets offer instruments such as derivatives to hedge against price fluctuations.
Efficiency: Efficient markets ensure optimal allocation of resources, reducing the cost of capital for businesses.
Economic Indicator: The performance of financial markets often reflects the health of an economy.
2. Key Functions of Financial Markets
Financial markets are not just for trading—they perform several vital functions that sustain the economy:
Mobilization of Savings: They attract individual and institutional savings and channel them into productive investments.
Facilitating Transactions: They enable the smooth transfer of funds between buyers and sellers.
Reducing Transaction Costs: Standardized processes reduce the cost of trading and make markets efficient.
Providing Marketability: Investors can sell securities quickly in liquid markets without significant losses.
Credit Availability: Financial markets provide mechanisms for borrowing and lending funds for various purposes.
Investment Opportunities: They provide diverse options for investing based on risk-return preferences.
Regulation and Stability: Well-regulated financial markets ensure transparency, fairness, and stability.
3. Classification of Financial Markets
Financial markets can be classified based on different criteria, such as the type of instrument traded, maturity period, and mode of trading. Broadly, they are divided into money markets and capital markets.
3.1 Money Market
The money market deals with short-term debt instruments that typically mature within one year. It is essential for managing liquidity in the economy.
Characteristics:
Short-term instruments
Low risk and low returns
High liquidity
Participants include commercial banks, corporations, and governments
Major Instruments in Money Market:
Treasury Bills (T-Bills): Government-issued short-term securities with maturities ranging from 91 to 364 days.
Commercial Paper (CP): Unsecured, short-term promissory notes issued by corporations to meet working capital needs.
Certificates of Deposit (CDs): Time deposits offered by banks, tradable in secondary markets.
Repurchase Agreements (Repos): Short-term borrowing using securities as collateral.
Significance: Money markets allow governments, banks, and corporations to efficiently manage short-term funding requirements.
3.2 Capital Market
The capital market deals with long-term securities with maturities beyond one year. It is divided into the primary market and the secondary market.
3.2.1 Primary Market
The primary market is where new securities are issued for the first time. It is crucial for capital formation.
Initial Public Offering (IPO): Companies raise funds from the public by issuing shares.
Follow-on Public Offer (FPO): Additional shares are issued by a company after an IPO.
Private Placements: Securities are sold directly to a limited number of institutional investors.
Rights Issue: Existing shareholders are offered new shares proportionate to their holdings.
Significance: The primary market provides the initial funding for companies, helping them expand operations and invest in growth.
3.2.2 Secondary Market
The secondary market is where previously issued securities are traded between investors.
Stock Exchanges: Organized platforms like NYSE, NASDAQ, and NSE facilitate trading of equities.
Over-the-Counter (OTC) Market: Securities are traded directly between parties without a centralized exchange.
Significance: Secondary markets provide liquidity, enabling investors to buy or sell securities easily, while also helping in price discovery.
4. Types of Financial Markets Based on Instruments
Apart from the money and capital market distinction, financial markets can also be classified based on instruments:
4.1 Stock Market (Equity Market)
Deals in company shares.
Provides investors ownership in corporations.
Helps companies raise equity capital for growth.
Examples: NYSE, NASDAQ, BSE, NSE.
4.2 Bond Market (Debt Market)
Deals in bonds and debentures issued by governments and corporations.
Investors lend money and receive periodic interest.
Less risky than equities but offer fixed returns.
Examples: Government bond markets, corporate bond markets.
4.3 Foreign Exchange Market (Forex)
Involves the trading of currencies.
Ensures liquidity for international trade and investment.
Influenced by macroeconomic factors like inflation, interest rates, and geopolitical events.
Participants: Central banks, commercial banks, multinational corporations, and retail traders.
4.4 Derivatives Market
Deals in contracts whose value is derived from underlying assets like stocks, bonds, currencies, or commodities.
Includes futures, options, swaps, and forwards.
Used for hedging risk and speculation.
Significance: Derivatives help investors manage financial risk efficiently.
4.5 Commodity Market
Trades raw materials like gold, silver, oil, and agricultural products.
Includes spot markets (immediate delivery) and futures markets (delivery at a future date).
Provides a platform for price discovery and risk management.
4.6 Cryptocurrency Market
Emerging digital asset market trading cryptocurrencies like Bitcoin, Ethereum, and stablecoins.
Operates 24/7 globally, often outside traditional financial systems.
High risk but offers significant opportunities for diversification and speculative trading.
5. Classification Based on Trading Mechanism
Financial markets can also be divided based on how trading occurs:
Organized/Exchange-Traded Markets: Regulated platforms with standardized contracts, like stock exchanges.
Over-the-Counter (OTC) Markets: Decentralized trading between two parties, e.g., Forex OTC markets.
Electronic/Online Markets: Internet-based platforms facilitating global trading with high efficiency and low costs.
6. Participants in Financial Markets
Financial markets include a wide range of participants who perform specific functions:
Investors: Individuals and institutions seeking returns.
Issuers: Companies and governments raising funds.
Intermediaries: Banks, brokers, and investment firms facilitating transactions.
Regulators: Authorities like SEBI, SEC, and RBI ensuring transparency and protecting investors.
Speculators: Traders aiming to profit from price fluctuations.
Hedgers: Participants managing risk using derivatives or other financial instruments.
7. Modern Trends in Financial Markets
Globalization: Markets are increasingly interconnected, enabling cross-border capital flows.
Technological Advancements: High-frequency trading, blockchain, and AI-driven analytics are transforming trading.
Sustainable Finance: ESG and green bonds are gaining importance.
Cryptocurrencies & Digital Assets: Digital currencies are expanding market opportunities.
Fintech Innovations: Mobile trading platforms and robo-advisors are democratizing access to markets.
8. Conclusion
Financial markets are the lifeblood of modern economies, facilitating the flow of capital, promoting investment, and enabling risk management. From money markets dealing with short-term debt instruments to capital markets providing long-term funding, each segment has a distinct role in economic development.
The evolution of financial markets—from traditional equity and debt instruments to sophisticated derivatives and digital assets—highlights their adaptability and centrality to global financial stability. Understanding these markets is essential for investors, policymakers, and businesses seeking to navigate the complex financial landscape efficiently.
Risk-Free and Low-Risk Trading Strategies1. Understanding Risk in Trading
1.1 What is Trading Risk?
Trading risk refers to the potential for loss due to market fluctuations, liquidity issues, or unforeseen economic and geopolitical events. Different asset classes carry different levels of risk:
Equities: Subject to company performance, market sentiment, and macroeconomic factors.
Forex: Volatile due to leverage, geopolitical events, and central bank policies.
Derivatives: High-risk instruments due to leverage and expiration dates.
Commodities: Influenced by supply-demand imbalances, weather, and global events.
Understanding risk is crucial for creating strategies that aim to minimize exposure while ensuring growth.
1.2 Types of Risk
Traders encounter several forms of risk:
Market Risk: Fluctuations in asset prices due to macroeconomic or sector-specific factors.
Credit Risk: The possibility that a counterparty defaults on financial obligations.
Liquidity Risk: Difficulty in buying or selling an asset without affecting its price.
Operational Risk: Failures in internal systems, processes, or human error.
Systemic Risk: Large-scale financial events affecting entire markets.
Low-risk strategies are designed to reduce market and systemic risk while providing predictable returns.
2. Risk-Free vs. Low-Risk Trading
2.1 Risk-Free Trading
In reality, no investment is entirely risk-free, but some instruments are considered nearly risk-free:
Government Bonds: Especially from stable economies like U.S. Treasuries.
Bank Fixed Deposits: Insured and low volatility.
Cash Equivalents: Money market funds, Treasury bills, and other short-term instruments.
These instruments provide predictable returns with minimal exposure to market fluctuations.
2.2 Low-Risk Trading
Low-risk trading involves strategies designed to protect capital while generating small, steady profits. These strategies accept minor risks in exchange for higher liquidity, flexibility, and compounding benefits.
3. Key Principles of Low-Risk Trading
Capital Preservation: The main goal is to avoid large drawdowns.
Diversification: Spreading capital across assets reduces single-asset exposure.
Risk-Reward Management: Targeting small, consistent profits while keeping losses limited.
Position Sizing: Allocating only a small percentage of capital per trade.
Leverage Caution: Avoiding excessive leverage, which amplifies both gains and losses.
Stop-Loss Orders: Automatic exit points to prevent catastrophic losses.
Consistent Evaluation: Continuous review of performance and market conditions.
4. Popular Low-Risk Trading Strategies
4.1 Hedging Strategies
Hedging involves opening positions to offset potential losses in existing investments. Common methods include:
a) Options Hedging
Protective Put: Buying a put option on a stock you own to guard against downside.
Covered Call: Selling a call option while holding the underlying stock to earn premiums.
Example:
If you own 100 shares of a stock priced at $50 and buy a put with a $48 strike, you limit your loss to $2 per share if the stock falls.
b) Futures Hedging
Locking in prices of commodities or currencies through futures contracts.
Common among farmers, exporters, and importers to stabilize cash flows.
c) Currency Hedging
Used by traders exposed to foreign currencies.
Involves forward contracts or options to mitigate exchange rate risk.
Advantages: Reduces exposure to price fluctuations.
Disadvantages: Hedging costs (premiums) may reduce profits.
4.2 Arbitrage Strategies
Arbitrage exploits price discrepancies between markets to earn nearly risk-free profits. Types include:
a) Spatial Arbitrage
Buying an asset in one market at a lower price and selling it in another at a higher price.
Example: Gold priced differently on NY and London exchanges.
b) Triangular Forex Arbitrage
Exploiting discrepancies in currency pairs.
Example: USD/EUR, EUR/GBP, and GBP/USD cross-rates not aligned.
c) Statistical Arbitrage
Using algorithms to detect short-term mispricing in stocks or derivatives.
Relies on historical price correlations.
Advantages: Minimal market risk when executed quickly.
Disadvantages: Requires sophisticated tools, low margins, and high transaction costs.
4.3 Pair Trading
Pair trading involves going long on one asset and short on a correlated asset. The goal is to profit from relative price movements rather than absolute market direction.
Example:
Long Stock A and Short Stock B in the same industry.
If Stock A outperforms Stock B, the trade earns profit regardless of overall market movement.
Advantages: Market-neutral and reduces exposure to systematic risk.
Disadvantages: Correlation breakdowns can cause losses.
4.4 Dividend Capture Strategy
This strategy focuses on buying stocks just before the ex-dividend date and selling shortly after to collect dividends. Key points:
Works best with stable, high-dividend-paying stocks.
Requires attention to ex-dividend dates and tax implications.
Market volatility may reduce gains if stock prices drop significantly post-dividend.
Advantages: Steady income with low capital risk.
Disadvantages: Transaction costs and short-term price fluctuations can erode profits.
4.5 Low-Volatility Trading
Investing in low-volatility assets reduces exposure to sudden market swings. Techniques include:
Selecting stocks with low beta (less sensitive to market movements).
Using ETFs that track defensive sectors like utilities, healthcare, or consumer staples.
Focusing on short-term risk metrics, such as ATR (Average True Range) or standard deviation.
Advantages: Smooth returns, capital preservation.
Disadvantages: Lower upside potential compared to high-volatility trading.
4.6 Fixed-Income Laddering
Laddering involves buying bonds or deposits with staggered maturities to reduce interest rate risk. Example:
Invest $10,000 across 1-year, 2-year, and 3-year bonds.
As each bond matures, reinvest at current rates.
Advantages: Reduces interest rate risk, ensures liquidity.
Disadvantages: Returns are generally lower than equities or leveraged trades.
4.7 Trend-Following with Tight Risk Controls
Trend-following can be adapted for low-risk trading by using:
Small position sizes.
Trailing stop-loss orders to lock in profits.
Limiting trades to well-established trends in low-volatility markets.
Advantages: Potential for higher returns without excessive exposure.
Disadvantages: False breakouts can trigger small losses.
4.8 Market-Neutral Strategies
Market-neutral strategies aim for profits regardless of market direction:
Long/Short Equity: Simultaneously long undervalued stocks and short overvalued ones.
Delta-Neutral Options: Balancing options and underlying stock to eliminate directional risk.
Convertible Arbitrage: Buying convertible bonds and hedging with stock positions.
Advantages: Protects capital from systemic market movements.
Disadvantages: Complex, requires active monitoring.
5. Risk Management Tools
5.1 Stop-Loss and Take-Profit Orders
Automatic exit orders limit losses and secure profits. Types:
Fixed Stop-Loss: Predetermined price level.
Trailing Stop: Adjusts dynamically as the trade moves in favor.
5.2 Position Sizing and Capital Allocation
Risk per trade should be a small percentage of total capital (commonly 1–3%). This prevents single losses from wiping out the portfolio.
5.3 Portfolio Diversification
Spread investments across:
Asset classes: equities, bonds, commodities.
Sectors: healthcare, technology, finance.
Geographies: domestic and international markets.
5.4 Volatility-Based Risk Assessment
Use ATR, standard deviation, and beta to measure potential risk.
Adjust position sizes based on market volatility.
5.5 Hedging with Derivatives
Options and futures can protect the portfolio from adverse movements, creating synthetic risk-free exposures.
6. Implementing Low-Risk Trading in Practice
Define Your Risk Tolerance: Determine how much loss you can withstand per trade and per portfolio.
Select Suitable Assets: Focus on low-volatility, high-liquidity instruments.
Choose a Strategy: Hedging, pair trading, dividend capture, or fixed-income laddering.
Set Entry and Exit Rules: Use technical indicators or calendar events.
Monitor and Adjust: Review trades regularly and adjust stop-loss or hedge positions.
Use Technology: Automated platforms, robo-advisors, and algorithmic trading can improve execution speed and reduce human error.
Review Performance: Keep a trading journal for continuous improvement.
7. Advantages of Low-Risk Trading
Capital Preservation: Minimizes the probability of catastrophic losses.
Predictable Returns: Provides steady, compounding growth.
Lower Stress Levels: Less emotional volatility than high-risk trading.
Diversification Opportunities: Can coexist with high-risk trades for balanced portfolios.
Sustainable Strategies: Works well for long-term wealth accumulation.
8. Limitations and Considerations
Lower Returns: Conservatism comes at the cost of reduced upside potential.
Time-Consuming: Hedging and monitoring multiple positions require discipline.
Hidden Costs: Transaction fees, option premiums, and slippage can reduce profits.
Market Anomalies: Even low-risk strategies are not immune to systemic crises.
Skill Requirement: Some low-risk methods, like arbitrage, require technical expertise.
9. Case Studies
9.1 Covered Call Example
Stock XYZ trades at $100.
Sell a call option with $105 strike for $2 premium.
Stock rises to $106 → exercise the call; stock sold at $105 plus $2 premium → profit locked at $7.
Stock drops to $98 → $2 premium cushions the loss.
9.2 Pair Trading Example
Long Stock A at $50, short Stock B at $60.
After a month, Stock A rises to $55, Stock B rises to $61.
Relative gain: Stock A +$5, Stock B short -$1 → net profit $4 per share.
9.3 Bond Laddering Example
$10,000 split: $3,000 in 1-year, $3,500 in 2-year, $3,500 in 3-year bonds.
Staggered maturities reduce exposure to interest rate fluctuations and maintain liquidity.
10. Conclusion
Risk-free and low-risk trading strategies focus on capital preservation, predictable returns, and market risk mitigation. While no trading method is truly risk-free, strategies like hedging, arbitrage, pair trading, dividend capture, and fixed-income laddering significantly reduce exposure. The key lies in combining:
Disciplined risk management
Diversification across assets
Strategic use of derivatives and technical tools
By carefully implementing these methods, traders can achieve consistent returns, reduce stress, and build wealth sustainably over the long term. Low-risk trading is particularly suitable for conservative investors, retirees, and professionals seeking steady growth while protecting capital from unpredictable market events.
Crypto Trading Guide1. Introduction to Crypto Trading
Cryptocurrency trading involves buying, selling, and exchanging digital assets in order to profit from price fluctuations. Unlike traditional markets, crypto trading operates 24/7 due to the decentralized nature of blockchain technology. The crypto market is highly volatile, which presents both opportunities and risks for traders. Popular cryptocurrencies include Bitcoin (BTC), Ethereum (ETH), Ripple (XRP), Cardano (ADA), and many more altcoins.
Crypto trading is divided into two main categories:
Spot Trading: Buying and selling cryptocurrencies for immediate settlement.
Derivatives Trading: Using financial contracts like futures and options to speculate on price movements without owning the underlying asset.
2. Understanding the Crypto Market
2.1 Market Structure
The crypto market is unique in its decentralized, borderless structure. Unlike traditional markets with centralized exchanges, crypto operates via:
Centralized Exchanges (CEX): Platforms like Binance, Coinbase, and Kraken. These offer high liquidity but require trust in the platform.
Decentralized Exchanges (DEX): Platforms like Uniswap and SushiSwap. These run on smart contracts and allow peer-to-peer trading.
2.2 Market Participants
Crypto market participants include:
Retail Traders: Individual traders buying or selling for personal gain.
Institutional Traders: Hedge funds, banks, and large investors.
Market Makers: Entities that provide liquidity by simultaneously placing buy and sell orders.
2.3 Market Hours
Unlike stock markets, crypto markets operate 24/7, which allows traders to react to news and events instantly. However, this also increases the risk of impulsive decisions.
3. Types of Crypto Trading
3.1 Spot Trading
Spot trading is the simplest form of crypto trading where traders buy crypto at current market prices. Key considerations include:
Order Types: Market orders (buy/sell immediately), limit orders (buy/sell at a specific price), and stop-loss orders (automated exit at a set loss level).
Portfolio Diversification: Spreading investments across multiple assets reduces risk.
Risk Management: Setting strict entry and exit rules is critical due to high volatility.
3.2 Margin Trading
Margin trading allows traders to borrow funds to increase exposure. For example, with 10x leverage, a $100 trade controls $1000 worth of assets.
Risks: Margin trading amplifies both profits and losses. Liquidation occurs if losses exceed collateral.
3.3 Futures and Options Trading
Derivatives trading enables speculation on price movements:
Futures Contracts: Agreements to buy or sell an asset at a future date at a predetermined price.
Options Contracts: Rights (but not obligations) to buy or sell at a fixed price within a certain time.
Perpetual Contracts: Futures with no expiry, commonly used in crypto derivatives markets.
3.4 Algorithmic and Bot Trading
Automated trading uses algorithms to execute trades based on predefined strategies:
Trend-following bots: Buy in uptrends, sell in downtrends.
Arbitrage bots: Exploit price differences between exchanges.
Market-making bots: Provide liquidity while capturing spreads.
4. Fundamental Analysis (FA) in Crypto
FA evaluates a cryptocurrency’s intrinsic value based on technology, adoption, and market dynamics. Key factors include:
Whitepapers: Technical documents explaining the coin’s purpose, roadmap, and use cases.
Development Activity: Active GitHub commits and project updates indicate sustainability.
Network Metrics: On-chain data like transaction volume, wallet addresses, and staking rates.
Regulatory Environment: Government policies can significantly affect prices.
5. Technical Analysis (TA) in Crypto
TA uses historical price data to predict future trends. Key tools and concepts include:
5.1 Chart Patterns
Triangles, Head & Shoulders, Double Tops/Bottoms: Patterns indicate potential reversals or continuations.
Support and Resistance Levels: Price points where buying or selling pressure is strong.
5.2 Indicators and Oscillators
Moving Averages (MA): SMA, EMA help identify trends.
Relative Strength Index (RSI): Measures overbought or oversold conditions.
MACD (Moving Average Convergence Divergence): Trend and momentum indicator.
Bollinger Bands: Measure volatility and potential breakout points.
5.3 Volume Analysis
High trading volume confirms price trends, while low volume may indicate weak moves.
6. Risk Management
Effective risk management is crucial in crypto due to volatility:
Position Sizing: Risk only a small percentage (1–3%) of your capital per trade.
Stop-loss Orders: Limit potential losses automatically.
Diversification: Spread investments across multiple coins and strategies.
Avoid Overleveraging: Using excessive leverage increases the chance of liquidation.
7. Trading Strategies
7.1 Day Trading
Traders buy and sell within the same day to profit from short-term price movements. Requires constant monitoring.
7.2 Swing Trading
Holding positions for days or weeks to capture medium-term trends. Combines TA and FA.
7.3 Scalping
Quick trades lasting seconds to minutes. Focuses on small price changes with high frequency.
7.4 HODLing
Long-term strategy where traders hold assets regardless of market fluctuations. Common with Bitcoin and Ethereum.
8. Psychology of Crypto Trading
Emotional discipline separates successful traders from losers:
Avoid FOMO (Fear of Missing Out): Impulsive buying during rapid price surges can lead to losses.
Control Greed: Exiting trades too late can reverse profits.
Patience and Discipline: Following a strategy consistently is more important than predicting the market perfectly.
9. Security and Safety
Crypto security is critical due to hacks and scams:
Wallets:
Hot Wallets: Online wallets for active trading; convenient but vulnerable.
Cold Wallets: Offline storage; highly secure for long-term holdings.
Two-Factor Authentication (2FA): Adds an extra security layer.
Exchange Reputation: Use reputable exchanges with insurance and strong security protocols.
10. Taxes and Regulations
Crypto trading is subject to tax in most countries. Regulations vary widely:
Taxable Events: Selling crypto, converting to fiat, or trading one coin for another.
Reporting Requirements: Maintain transaction records for audits.
Regulatory Compliance: Know your country’s laws to avoid legal issues.
11. Tools and Resources
Traders rely on tools for research, trading, and risk management:
Trading Platforms: Binance, Coinbase, Kraken.
Charting Tools: TradingView, Coinigy.
News Sources: CoinDesk, CoinTelegraph, CryptoSlate.
Portfolio Trackers: Blockfolio, Delta App.
12. Common Mistakes to Avoid
Ignoring risk management rules.
Overtrading or excessive leverage.
Falling for pump-and-dump schemes.
Neglecting security practices.
Blindly following social media tips.
13. Emerging Trends in Crypto Trading
DeFi (Decentralized Finance): Lending, borrowing, and yield farming.
NFTs (Non-Fungible Tokens): Digital collectibles and gaming assets.
Layer 2 Solutions: Faster, cheaper transactions on Ethereum (e.g., Polygon).
AI-Powered Trading: Leveraging artificial intelligence for predictive analytics.
14. Conclusion
Crypto trading offers immense profit potential but comes with high risk. Success requires a combination of:
Strong technical and fundamental analysis skills.
Effective risk and money management.
Psychological discipline and patience.
Staying updated with market trends, news, and regulatory changes.
By developing a systematic trading plan, diversifying strategies, and prioritizing security, traders can navigate the volatile crypto markets more confidently.
Breakout and Breakdown Trading1. Introduction to Breakout and Breakdown Trading
In financial markets, price movement is influenced by the forces of supply and demand. Traders identify key levels where these forces tend to converge and then anticipate movements when price “breaks out” above a resistance level or “breaks down” below a support level.
Breakout Trading: A strategy that involves entering a position when the price moves above a defined resistance level with the expectation of further upward momentum.
Breakdown Trading: The opposite approach, where traders enter a position when the price falls below a support level, anticipating a continuation of downward movement.
These strategies are rooted in technical analysis, relying on historical price action and market psychology rather than fundamental factors.
2. Core Concepts
2.1 Support and Resistance
Support: A price level where buying interest is strong enough to prevent further decline. It acts as a “floor.”
Resistance: A price level where selling pressure is strong enough to prevent further increase. It acts as a “ceiling.”
Breakouts occur when price surpasses resistance, while breakdowns happen when price falls below support.
2.2 Volume
Volume is a crucial confirmation tool. A breakout or breakdown is considered strong if accompanied by increased trading volume, as this indicates genuine market participation rather than a false move.
2.3 Price Consolidation
Before breakouts or breakdowns, prices often consolidate in tight ranges. These consolidations can be:
Rectangles
Triangles
Flags and pennants
Understanding the consolidation pattern helps traders anticipate the direction and magnitude of the breakout or breakdown.
3. Types of Breakouts and Breakdowns
3.1 Horizontal Breakouts
Occur when price breaks a clearly defined horizontal support or resistance.
Example: A stock repeatedly fails to move above $100. A breakout above $100 signals upward momentum.
3.2 Trendline Breakouts
Occur when price crosses a diagonal trendline drawn along highs or lows.
Uptrend breakout: Price breaks above a descending trendline.
Downtrend breakdown: Price falls below an ascending trendline.
3.3 Pattern-Based Breakouts
Certain chart patterns often precede strong breakouts or breakdowns:
Triangles: Symmetrical, ascending, or descending triangles
Rectangles: Price moves within a horizontal range
Flags and Pennants: Continuation patterns after a sharp move
Pattern-based breakouts tend to offer predictable price targets based on pattern dimensions.
4. Breakout Trading Strategy
4.1 Identifying a Breakout
Look for a well-defined resistance level or consolidation pattern.
Confirm breakout using volume: higher than average volume indicates strong buying interest.
Check for fundamental or news catalysts that may strengthen the breakout.
4.2 Entry Techniques
Aggressive Entry: Enter immediately when price crosses resistance.
Conservative Entry: Wait for a candle to close above resistance to confirm breakout.
4.3 Stop Loss Placement
Below the breakout point or recent swing low.
Helps protect against false breakouts.
4.4 Profit Targets
Use pattern-based targets: For triangles or rectangles, project the height of the pattern above breakout.
Use trailing stops to capture extended moves without exiting too early.
5. Breakdown Trading Strategy
5.1 Identifying a Breakdown
Look for a strong support level or consolidation pattern.
Check for rising selling volume: heavy selling confirms breakdown.
Identify any macroeconomic or sector-specific events that may accelerate declines.
5.2 Entry Techniques
Aggressive Entry: Enter immediately as the price breaks support.
Conservative Entry: Wait for a candle close below support to reduce risk.
5.3 Stop Loss Placement
Above the breakdown point or recent swing high.
Protects against false breakdowns where the price quickly recovers.
5.4 Profit Targets
Pattern-based projections: Use the height of the consolidation pattern subtracted from the breakdown point.
Trailing stops help lock in gains in volatile markets.
6. Psychological Aspects of Breakout and Breakdown Trading
Trading breakouts and breakdowns is as much psychological as technical:
6.1 Fear of Missing Out (FOMO)
Many traders enter too early due to FOMO, risking false breakouts.
Patience and confirmation reduce this risk.
6.2 Market Sentiment
Breakouts often occur when sentiment shifts from neutral or negative to bullish.
Breakdowns often coincide with panic selling or negative news.
6.3 Confirmation Bias
Traders may see a breakout or breakdown where none exists.
Strict adherence to predefined rules prevents bias-driven errors.
7. Common Mistakes and Risks
7.1 False Breakouts/Breakdowns
Occur when price briefly crosses support or resistance but reverses immediately.
Mitigation: Wait for candle close, confirm with volume, and consider broader market trend.
7.2 Overleveraging
Using excessive margin amplifies losses if breakout fails.
Always use proper risk management (1–2% of capital per trade).
7.3 Ignoring Market Context
Breakouts in choppy or low-liquidity markets are less reliable.
Always consider overall market trend, sector strength, and macroeconomic factors.
8. Tools and Indicators for Confirmation
8.1 Volume Indicators
On-Balance Volume (OBV)
Volume Oscillator
8.2 Momentum Indicators
RSI (Relative Strength Index): Confirms overbought or oversold conditions
MACD (Moving Average Convergence Divergence): Identifies trend shifts
8.3 Moving Averages
Help confirm breakout/breakdown trend direction.
Common strategy: Wait for price to cross above/below 20-day or 50-day moving average.
9. Examples of Breakout and Breakdown Trading
9.1 Breakout Example
Stock consolidates between $50–$55.
Breaks above $55 on heavy volume, closing at $56.
Entry: $56
Stop Loss: $54.50 (below consolidation)
Target: $61 (height of consolidation added to breakout level)
9.2 Breakdown Example
Stock trades between $70–$65.
Falls below $65 with high volume, closing at $64.
Entry: $64
Stop Loss: $66 (above consolidation)
Target: $59 (height of consolidation subtracted from breakdown level)
10. Advanced Techniques
10.1 Pullback Entry
After breakout, price often retests the breakout level.
Provides lower-risk entry opportunities.
10.2 Multiple Timeframe Analysis
Confirm breakout on higher timeframe (daily or weekly) while entering on lower timeframe (hourly or 15-min).
Reduces the likelihood of false breakouts.
10.3 Combining with Fundamental Analysis
Breakouts accompanied by strong earnings, positive news, or macroeconomic support have higher reliability.
Breakdowns following negative news or sector weakness confirm downward trend.
Conclusion
Breakout and breakdown trading is a cornerstone of technical trading, blending market psychology, price action, and disciplined risk management. While the concept is simple—buy above resistance and sell below support—the execution requires attention to volume, patterns, market context, and trading psychology. Traders who master these strategies can capitalize on strong momentum moves and manage risk effectively.
Successful breakout and breakdown trading hinges on patience, confirmation, proper entry and exit points, and disciplined risk management. By combining technical indicators, volume analysis, and pattern recognition, traders can improve the probability of capturing meaningful market moves while avoiding the pitfalls of false signals.
Zero-Day Option TradingIntroduction
Zero-Day Option Trading (ZDOT), also referred to as 0DTE (Zero Days to Expiration) trading, has gained significant traction in the last few years, particularly among professional traders and high-frequency retail traders. The strategy revolves around trading options contracts that expire on the same day, often within hours. This ultra-short-term trading method leverages rapid price movements, time decay, and market volatility to generate potential profits.
While zero-day options present extraordinary opportunities, they also carry significant risk due to their extreme sensitivity to market movements and time decay. Understanding ZDOT requires knowledge of option pricing, market mechanics, strategies, and risk management.
Understanding Options Basics
Before diving into zero-day options, it is essential to revisit the fundamentals of options trading.
Options Types
Call Options: Give the holder the right, but not the obligation, to buy an underlying asset at a predetermined price (strike price) before expiration.
Put Options: Give the holder the right, but not the obligation, to sell an underlying asset at a predetermined price before expiration.
Option Pricing Factors
Options prices are derived from models like the Black-Scholes Model and are influenced by:
Underlying Asset Price: Directly affects the intrinsic value.
Strike Price: Determines whether the option is in-the-money (ITM), at-the-money (ATM), or out-of-the-money (OTM).
Time to Expiration (Theta): Represents time decay; the closer to expiry, the faster an option loses value.
Volatility (Vega): Higher volatility increases the option premium.
Interest Rates and Dividends: Affect the option's theoretical price marginally.
Option Greeks
Understanding Greeks is crucial in ZDOT because the risk-reward profile changes rapidly:
Delta (Δ): Measures the option’s price sensitivity to the underlying asset price.
Gamma (Γ): Measures the rate of change of delta; higher gamma means price reacts sharply to underlying moves.
Theta (Θ): Measures time decay; for zero-day options, theta is extremely high.
Vega (ν): Measures sensitivity to volatility.
Rho (ρ): Measures sensitivity to interest rates (less relevant for ZDOT).
What Are Zero-Day Options?
Zero-day options are options contracts that expire the same day they are traded. For example, if an S&P 500 index option expires on a Friday, a trader could enter a trade on Friday morning, and the contract would expire by market close.
Key characteristics include:
Ultra-Short Expiry: Time decay is at its peak, and option value is primarily extrinsic premium.
High Gamma: Small moves in the underlying asset lead to large changes in option delta.
Rapid Time Decay: Theta accelerates as the expiration hour approaches, making options highly sensitive.
High Liquidity (for popular underlyings): Index options (like SPX, NIFTY, or ES futures options) often offer tight spreads and high volume.
Speculative Nature: Traders often use these options for intraday speculation rather than long-term investment.
Why Zero-Day Options Have Gained Popularity
Several factors contribute to the rise of zero-day option trading:
Low Capital Requirement: Traders can take positions on small premium options with relatively low capital.
Leverage: Due to low cost and high delta, traders can control large exposure to the underlying asset.
High Reward Potential: Rapid price swings in the underlying asset can generate significant profits.
Advanced Technology and Platforms: High-frequency trading, algorithmic strategies, and low-latency platforms make execution faster.
Volatility-Based Strategies: Intraday volatility spikes (like FOMC announcements, economic data releases, or corporate earnings) create opportunities for short-term traders.
How Zero-Day Options Work
1. Time Decay (Theta)
Zero-day options are almost entirely driven by time decay. Theta measures the rate at which the option loses extrinsic value:
For long option holders, the value decays extremely fast.
For short option sellers, theta works in their favor as options lose value rapidly as expiration approaches.
Example:
A call option on NIFTY at-the-money might lose 50–70% of its value in the last few hours of trading due to accelerated theta.
2. Delta and Gamma
Delta indicates the likelihood of the option ending in-the-money:
At-the-money (ATM) zero-day options have a delta near 0.5.
Gamma is extremely high for ATM zero-day options, meaning small movements in the underlying asset can swing the delta dramatically.
Traders can quickly move from profitable to loss positions or vice versa.
3. Volatility (Vega)
Vega sensitivity diminishes as expiration nears.
ZDOT primarily focuses on underlying price movement rather than changes in implied volatility.
Volatility spikes can still create profitable opportunities, especially during market open or news events.
4. Liquidity and Execution
SPX, NIFTY, ES, and other major indices offer high liquidity.
Tight bid-ask spreads reduce slippage and execution risk.
Deep liquidity is essential as zero-day trading relies on quick entry and exit.
Common Zero-Day Option Strategies
Traders employ several strategies depending on their risk tolerance and market outlook. These can broadly be divided into directional and non-directional strategies.
1. Directional Strategies
These strategies assume a specific price movement in the underlying asset:
a. Buying ATM Calls or Puts
Traders speculate on intraday price movement.
High gamma can turn small moves into significant profits.
High risk due to rapid theta decay.
b. Long Straddle
Buying ATM call and put simultaneously.
Profitable if underlying moves sharply in either direction.
Risk: If the market remains flat, both options decay quickly.
c. Long Strangle
Buying slightly OTM call and put.
Less expensive than straddle.
Requires a larger move to become profitable.
2. Non-Directional / Theta-Based Strategies
These strategies aim to profit from time decay rather than directional moves:
a. Short Straddle
Selling ATM call and put simultaneously.
Profits if the market remains stable.
Extremely risky if underlying moves sharply.
b. Short Strangle
Selling OTM call and put.
Less risky than straddle, but still vulnerable to large moves.
c. Iron Condor
Selling OTM call and put while buying further OTM options for risk protection.
Profitable in low-volatility markets.
Limited risk, limited reward.
Risk Management in Zero-Day Option Trading
Zero-day trading is inherently high-risk. Effective risk management is critical for survival:
Position Sizing
Avoid allocating more than 1–2% of capital per trade.
Use small, calculated trades to minimize the risk of a total loss.
Stop Losses
Intraday exit rules are essential.
Some traders use delta-neutral stop-loss triggers or predefined percentage losses.
Hedging
Short and long combinations like iron condors provide built-in hedges.
Delta-hedging strategies can neutralize directional risk.
Volatility Awareness
Avoid trading near extreme market events unless prepared for rapid moves.
Sudden volatility spikes can wipe out short positions in seconds.
Market Hours and Liquidity
Trade during the most liquid periods (e.g., market open and last hour).
Avoid trading in illiquid or thinly traded instruments.
Advantages of Zero-Day Option Trading
High Profit Potential
The leverage effect of options can lead to significant intraday gains.
Rapid Feedback
Traders quickly see results, allowing rapid learning and strategy adjustments.
Flexibility
Both directional and non-directional strategies can be employed.
Scalability
Strategies can be applied across indices, stocks, commodities, and ETFs.
Disadvantages and Risks
Extreme Risk
A single wrong move can result in 100% loss of the premium for long options or unlimited loss for naked shorts.
Requires Expertise
Understanding Greeks, market microstructure, and timing is crucial.
Psychological Pressure
High-speed trading can induce stress and emotional errors.
Limited Margin for Error
Zero-day options leave no room for delayed reaction or misjudgment.
Practical Tips for Traders
Start Small
Begin with minimal exposure to learn the mechanics.
Focus on Highly Liquid Instruments
SPX, NIFTY, and ES are preferred due to tight spreads.
Use Technical Analysis
Short-term support, resistance, and intraday momentum patterns can guide entry and exit.
Combine Strategies
Blend directional bets with non-directional strategies to manage risk.
Track News Events
Economic releases and earnings can cause rapid price swings suitable for zero-day trades.
Regulatory and Brokerage Considerations
Some brokers restrict zero-day option trading due to high risk.
Margin requirements may be higher for selling options.
Traders must be aware of regulatory guidelines in their region (e.g., SEBI in India, SEC in the U.S.).
Conclusion
Zero-Day Option Trading is a high-risk, high-reward intraday trading technique that has gained popularity due to low capital requirements, rapid time decay, and leverage opportunities. While it offers extraordinary profit potential, the strategy demands discipline, expertise, and rigorous risk management. Traders must understand option Greeks, market volatility, liquidity, and intraday technical patterns to succeed.
For beginners, zero-day trading should be approached cautiously, starting with small trades and focusing on education. For experienced traders, it offers a tool to exploit rapid market movements, hedge positions, or implement advanced strategies like gamma scalping.
In essence, ZDOT is not for the faint-hearted—it is a strategy where precision, timing, and strategy execution determine success. With proper planning and discipline, zero-day option trading can be a powerful component of an intraday trader’s toolkit.
