FEDDERS: MFTC Uprising Curve CONFIRMEDMFTC is bullish on FEDDERSHOL! 🔥
The stock is showing a potential MFTC Uprising Curve confirmation, suggesting that the underlying bullish structure may be preparing for another expansion move.
📈 MFTC Setup
The Uprising Curve is one of the key MFTC structures where price progressively builds higher levels while respecting the rising curve.
If the structure continues to hold, FEDDERSHOL could potentially see a 30–50% upside in the coming weeks.
🎯 MFTC Scenario
Current structure → Dip → Bullish re
Yashkhajania
MSTR $400 NEXT? | MFTC Bullish SetupMSTR — MFTC Bullish Outlook | Weekly Dips Could Offer Buying Opportunities
According to the MFTC framework, Strategy Inc. (NASDAQ: MSTR) remains structurally bullish.
MSTR is currently trading around $160, while Bitcoin is around $85K. Investing.com
The key observation is the multi-timeframe alignment between BTC and MSTR:
- BTC — Monthly: Initial Reversal (I.R.) structure is developing.
- MSTR — Weekly: Initial Reversal (I.R.) structure is visible.
- MSTR has recently reached a weekly supply/re
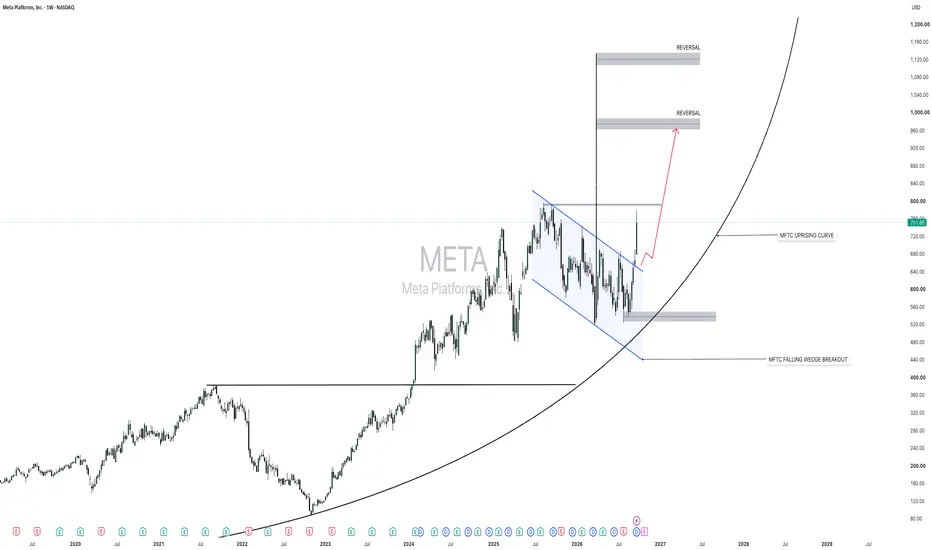
META VR GLASSES ARE HERE— MFTC BULLISH ON META TILL 2028 META IS TRENDING AFTER THE NEW VR GLASSES ANNOUNCEMENT — BUT THE MFTC CHART WAS ALREADY SHOWING SOMETHING INTERESTING. 👀
META is showing a potentially significant MFTC bullish structure on the Weekly chart, with the price breaking out of a long-term Falling Wedge.
The larger-timeframe structure remains constructive, with the MFTC Uprising Curve providing an additional structural reference for the projected path.
🔵 MFTC Analysis
META has developed a clear Falling Wedge structure on the Weekly
XAUUSD 30M Bullish Reversal After I.R.XAUUSD has given a 30M Initial Reversal (I.R.) confirmation from the MFTC buyer zone.
According to the MFTC setup, the Decline Curve / ACS structure reached the projected demand area, followed by a bullish reversal on the 30-minute timeframe.
📈 MFTC Setup
Structure: Decline Curve — ACS
Zone: Strong Buyer Level
Confirmation: 30M I.R. ✅
Bias: Bullish reversal
Next expectation: Upside move toward the Decline Curve and potential curve breakout
MFTC View:
“30M I.R. has confirmed the bullish rever
XAUUSD — MFTC Bullish Reversal SetupXAUUSD is showing a potential bullish reversal structure on the 1H chart.
According to the MFTC framework, the higher-timeframe context remains consolidation on the Daily and Weekly charts. With price approaching the 4,300 area, the focus is on how price reacts around this demand/reversal zone.
MFTC Plan
Key zone: 4,300 / below 4,300
Bias: Potential bullish reversal
Entry confirmation: Wait for a valid I.R. (Initial Reversal) on the 15M–1H timeframe
Invalidation: If the reversal structure fail
XAUUSD 4H — MFTC Fakeout of Head & Shoulders | Reversal SetupXAUUSD is showing a potential MFTC fakeout of the Head & Shoulders pattern on the 4H timeframe.
Price has broken below the neckline/support area, but according to the MFTC price-action concept, this can act as a fake breakdown / liquidity hunt rather than a genuine bearish continuation.
The bigger picture also supports the idea of price aligning with the weekly timeframe consolidation structure, increasing the probability of a reversal from the current area.
🔥 Trade Plan
4H Structure: Potenti
NAS100 4H MFTC Analysis — Bullish SetupNAS100 is showing a bullish structure on the 4H timeframe.
After the recent liquidity sweep + double-bottom formation, price is again attempting to challenge the 29,700–29,750 resistance/high zone.
🔥 My MFTC Bias
The structure remains bullish as long as the 29,000–29,100 area holds.
If NAS100 gives a dip into the 29,000–29,200 reversal zone, I will be looking for a buying opportunity, rather than chasing price at the current level.
Intraday Entry:
Once price reaches the buy zone, wait for a