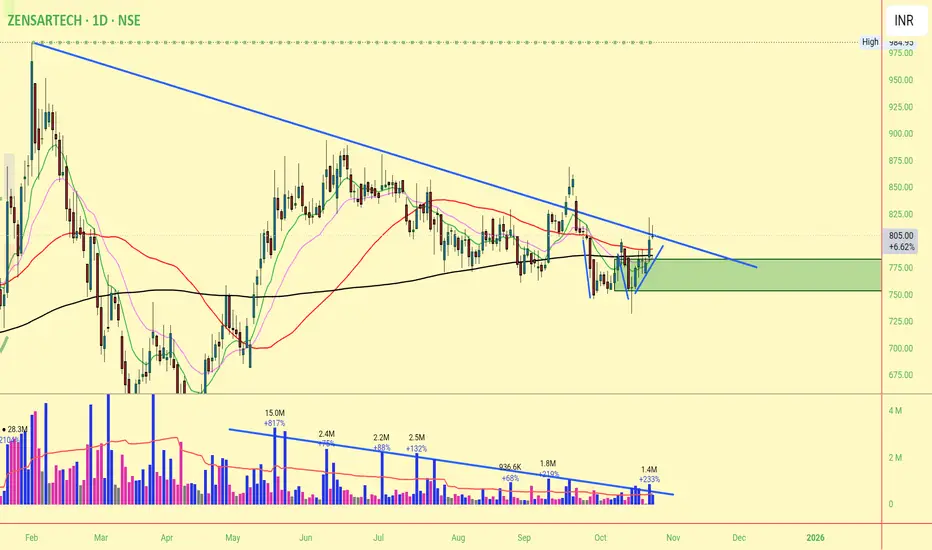
ZENSARTECH
ZENSAR TECHNOLOGIESZensar Technologies is a leading digital solutions and technology services company. It is a part of the Mumbai-based RPG group and is headquartered in Pune, India. It operates in two segments: Application Management Service and Infrastructure management service. It is focused on industry verticals, such as Hitech & manufacturing, consumer services, and banking, financial services, and insurance. They have offices located in India, the USA, UK, Europe, and Africa
Revenue Segments FY24
Hitech : 2
ZENSARTECH BREAKOUT 🚀🚀 (Inverted Head & Shoulder) Zensar Technologies Ltd has hit it's all time high with a very strong bullish pattern which is called as the inverted Head & Shoulder or (tripple bottom by a few ).
Zensar Technologies Ltd has been performing pretty good from a few quarters . The net profit of the company is increasing along with its sales , also the Earning of the company is increasing with good momentum as well . This is now visible on the charts.
ZENSARTECHWhat Does a Cup and Handle Pattern Tell You?
American technician William J. O'Neil defined the cup and handle (C&H) pattern in his 1988 classic, How to Make Money in Stocks, adding technical requirements through a series of articles published in Investor’s Business Daily, which he founded in 1984.
1
William J. O'Neil. "How to Make Money in Stocks." McGraw-Hill Education, 2009.
O'Neil included time frame measurements for each component, as well as a detailed description of the rounded lows that
ZENSAR TECHNOLOGYNSE:ZENSARTECH
ZENSAR TECHNOLOGY was taking support at 200 & finally giving a good weekly breakout above 250.
Volumes is also increased recently.
The target according to Fibonacci Levels are - 1) 310. 2) 366. 3) 435.
Buy at current price, SL should be below 200 on weekly closing basis.
Reversal in ZENSARTECH
ZENSARTECH is attempting a reversal from its 52W Low of 201. It formed a morning star formation and subsequently crossed 200 DMA with high volume. CMP is already more than 52W Low by more than 25%.
Currently it has passed 22 days since crossing 200 DMA and chart looks strong for bullish momentum.
ZENSAR TECH ( 1HR TIME FRAME )In 1 hr time frame its been folllowing a specific path and now the stock is at its support level (496.20).
Technical indicators (RSI & STOCHASTICS) also confirms an upward movement
Target -536
BUY @ 500
SL @ 488
Risk to reward ratio - 3:1
Not a financial advise. Use your own analysis to confirm your entry.
Target 1 (16%) achieved in Zensar Technologie. Target 2 is ON...This is follow-up on Zensar Technologie. Can check link to related ideas.
Target 1 achieved. More than 16%. Target 2 is ON.
Chart is self explanatory. Entry, Targets and Trailing Stop Loss are mentioned on the chart.
Disclaimer: This is for demonstration and educational purpose only. This is not buying or selling recommendations. I am not SEBI registered. Please consult your financial advisor before taking any trade.