• Products
  • Community
  • Markets
  • Brokers
  • More
Get started
  • Markets
  • /United Kingdom
  • /Stocks
  • /Ideas
Arnaldo Mondadri Editore stock long side movementArnaldo Mondadri Editore Stock Analysis** **Company Overview:** Arnaldo Mondadri Editore. is a prominent Indian multinational corporation with a diverse portfolio encompassing automotive manufacturing, aerospace, agribusiness, construction, defense, energy, hospitality, information technology, leisure and hospitality, and real estate. The company is renowned for its SUVs, commercial vehicles, and tractors, holding a significant market share in the Indian automotive sector. **Fundamental Analysis:** - **Market Capitalization:** Approximately ₹2.66 trillion. - **Price-to-Earnings (P/E) Ratio:** The stock is trading at a P/E ratio of 25.25, indicating a premium valuation compared to the industry average. - **Earnings Per Share (EPS):** ₹105.52, reflecting the company's profitability. - **Return on Equity (ROE):** 15.5%, demonstrating efficient use of shareholders' equity to generate profits. - **Debt-to-Equity Ratio:** 0.62, suggesting a moderate level of debt in the company's capital structure. - **Dividend Yield:** 1.2%, indicating a conservative dividend payout policy. **Technical Analysis:** - **Current Price:** ₹2,663.45. - **52-Week Range:** The stock has traded between ₹2,484.00 and ₹3,276.30 over the past year, indicating significant volatility. - **Support Levels:** - First Support: ₹2,600.00 - Second Support: ₹2,500.00 - **Resistance Levels:** - First Resistance: ₹2,800.00 - Second Resistance: ₹3,000.00 - **Breakout Point:** A sustained move above ₹2,800.00 could signal the start of a bullish trend. - **Retest Levels:** After a breakout above ₹2,800.00, a retest of this level would confirm its strength as new support. **Recent Performance:** - **1 Week:** The stock has decreased by 9.29%. - **1 Month:** The stock has decreased by 5.39%. - **6 Months:** The stock has decreased by 3.61%. **Analyst Ratings:** - Jefferies has maintained a 'Buy' rating on M&M with a target price of ₹4,075 per share, indicating an upside potential of approximately 28% from the current market price. - Goldman Sachs has also maintained a 'Buy' rating with a target price of ₹3,800 per share, suggesting a potential upside of approximately 19%. **Conclusion:** Mahindra & Mahindra Ltd. exhibits strong fundamentals with a diverse business portfolio and efficient use of equity. Technically, the stock is trading near its support levels, indicating potential for upward movement if these levels hold. Investors should monitor the breakout above ₹2,800.00 and consider the support levels at ₹2,600.00 and ₹2,500.00 for potential entry points. *Please note that stock market investments carry inherent risks. It is advisable to conduct thorough research or consult with a financial advisor before making investment decisions.*
TURQUOISE:MNMLong
by Ashwani123
FRESNILLO setting up for its redemption run Fresnillo is an interesting chart. Looks like a major bottom has set in. If by any chance price goes back to 460-455 level, I will not miss the opportunity to buy. If silver moves up towards $60-70 zone. This scrip will hit a home run. Onwards and Upwards. Stoploss can be placed at 450.
LSE:FRESLong
by nishant_bhatt
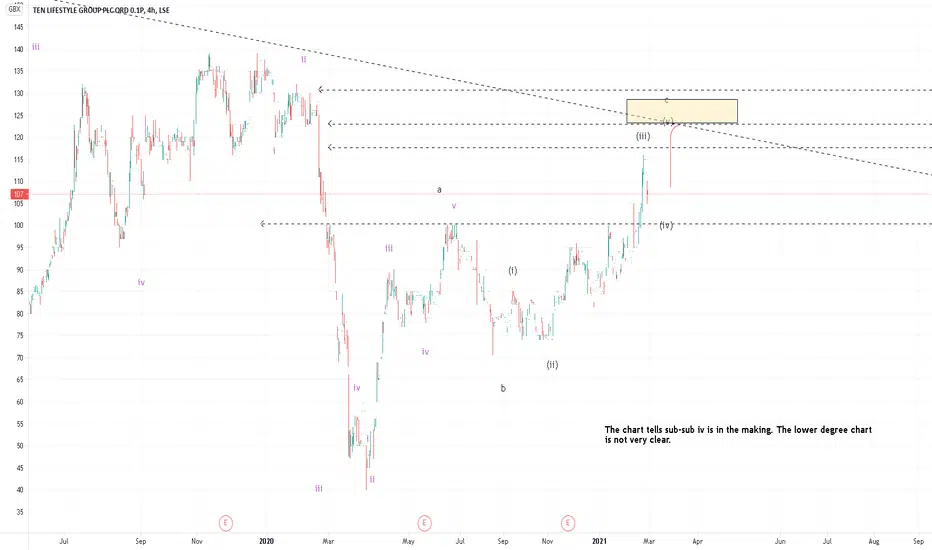
BreakoutOnce this breaks out of the channel, this should hit 174, 212 and 237 which are the previous highs since March 2020
LSE:IAGLong
by AC777777
11
#PREM with support levels and fib#PREM chart with future support levels and fib retracement
LSE:PREM
by beginvestor
11
cup with handle pattern last 20year most accurate pattern 100% this target will hit when...... ... god know only in six month i can say only use 3% capital for swing
LSE:EZJ
by hsvr8898
BARC LONGmest capital indicator has generated an alert of going long in equity for BARCCLAYS Timeframe: weekly Entry : High price of candel Stoploss: Low price of candel Happy trading 🙏
LSE:BARCLong
by UnknownUnicorn7443965
Updated
STAN LONGmest capital indicator has generated an alert of going long in equity for STANDARD CHARTERED Timeframe: weekly Entry : High price of candel Stoploss: Low price of candel Happy trading 🙏
LSE:STANLong
by UnknownUnicorn7443965
Updated
Simple Approach Gives lots of Results This post I am posting in order Explain that simple approach of using Pitchfork and Wave theory can Give you Better results in decision making Wave theory that suggest the Bull Market Trend and Pitchfork suggests the Trend Unfolding along the line of Standard deviation both become a Confirming Method to stay in the Trend as Long as Trend remain strong Hope this post will help you to isolate and use Tools in proper way Good luck
LSIN:0NX1
by ShreeKrishna_F
Target 38 ( 1 to 5 months )Good Up Trend going on, good Technical and Fundamental. Target 38 , duration 1 to 5 months
0Long
by Risk_is_yours
Target 159 ( 1 to 5 months )good Up trend going on ..... Technical and Fundamental good , Target 159 , Duration 1 to 5 months
LSE:0QI9Long
by Risk_is_yours
Target 15.2 ( 1 to 5 months )Good Technical and Fundamental ... Good Breakout ... Target 15.2
LSE:TMTLong
by Risk_is_yours
Argo longdeclining volume since the new year suggesting a breakout is soon. Recon it'll 3x at the latest by october, particually as btc grabs momentum. Needs to breakout of the log resistance.
LSE:ARBLong
by Jimmy205
Centamin Consolidating again Long Term Uptrend.Expecing a brief Touch to Mid 90s 95p before moving up. Consolidation usually when there is some reason to expect a catalyst to adjust to.
CLong
by BigRayBear888
good buygoot time to invest in aston martin as it is following the uptrend and will give good yield,currently in an uptrend .
LSE:AMLLong
by LOUISMAXET
TENG lower degree EWOm Namah Shivay The chart tells sub-sub iv is in the making. The lower degree chart is not very clear. The correction upto 100 is expected and a next up movement possible. Om Namah Shivay
LSE:TENG
by sudhannayak
TENG seems bullishWeekly chart seems bullish for a target of 118-123 protecting 100
LSE:TENG
by sudhannayak
Pearson on longOm Namah Shivay Monthly overview Possible that the stock will be bouncing up with a target to 920, 1023, .... The structure looks an impulse in monthly view, if it does not go below 706 and comes above 812, we can long for 908 Om Namah Shivay
LSE:PSONLong
by sudhannayak
Rolls Royes @ lowest Historical Level This is Perfect Example of History repeats . Rolls Royes almost touched its' historical low @ 64 Rs.
LSE:RR.Long
by timetrvl86
Rev H&SConsolidating post breakout ... Heading to all time highs >5200
LSE:ULVRLong
by smart07trader
RR fans, it takes 1 year or more...I also got a minority who asked me abt this stock here's a simplification that will save you time , alarms as usual and be there in time Will update here so no worries thank you again for the PMs and Support!
LSE:RR.Long
by LonelyApollo
Crude oil and BP, The TangoBrent has touched a new low but not BP. Just a matter of time.
LSE:BP.Short
by SWFguy
IAG Best buy below 160Critical support seems at near 135 best buy below 160
LSE:IAGShort
by afzal-anees
BKG (BERKELEY GROUP HOLDINGS) go long for target 3955BKG (BERKELEY GROUP HOLDINGS) has recently bounced from 50 EMA twice and is now looking set to reach a target 1 of 3955. Target 2 is 4240. Stoploss levels are 3750 and 3670. Exit the half the stock if it falls below 3750. Exit full if it falls below 3670.
LSE:BKGLong
by mkmunir3
1122
…999999

Select market data provided by ICE Data services. Select reference data provided by FactSet. Copyright © 2025 FactSet Research Systems Inc.© 2025 TradingView, Inc.

More than a product
  • Supercharts
Screeners
  • Stocks
  • ETFs
  • Bonds
  • Crypto coins
  • Crypto pairs
  • CEX pairs
  • DEX pairs
  • Pine
Heatmaps
  • Stocks
  • ETFs
  • Crypto
Calendars
  • Economic
  • Earnings
  • Dividends
More products
  • Yield curves
  • Options
  • News Flow
  • Pine Script®
Apps
  • Mobile
  • Desktop
Community
  • Social network
  • Wall of Love
  • Refer a friend
  • House Rules
  • Moderators
Ideas
  • Trading
  • Education
  • Editors' picks
Pine Script
  • Indicators & strategies
  • Wizards
  • Freelancers
Tools & subscriptions
  • Features
  • Pricing
  • Market data
Special offers
  • CME Group futures
  • Eurex futures
  • US stocks bundle
About company
  • Who we are
  • Manifesto
  • Athletes
  • Blog
  • Careers
  • Media kit
Merch
  • TradingView store
  • Tarot cards for traders
  • The C63 TradeTime
Policies & security
  • Terms of Use
  • Disclaimer
  • Privacy Policy
  • Cookies Policy
  • Accessibility Statement
  • Security vulnerability
  • Status page
Business solutions
  • Widgets
  • Charting libraries
  • Lightweight Charts™
  • Advanced Charts
  • Trading Platform
Growth opportunities
  • Advertising
  • Brokerage integration
  • Partner program
  • Education program
Community
  • Social network
  • Wall of Love
  • Refer a friend
  • House Rules
  • Moderators
Ideas
  • Trading
  • Education
  • Editors' picks
Pine Script
  • Indicators & strategies
  • Wizards
  • Freelancers
Business solutions
  • Widgets
  • Charting libraries
  • Lightweight Charts™
  • Advanced Charts
  • Trading Platform
Growth opportunities
  • Advertising
  • Brokerage integration
  • Partner program
  • Education program
Look FirstLook First