Indicators, Strategies and Libraries
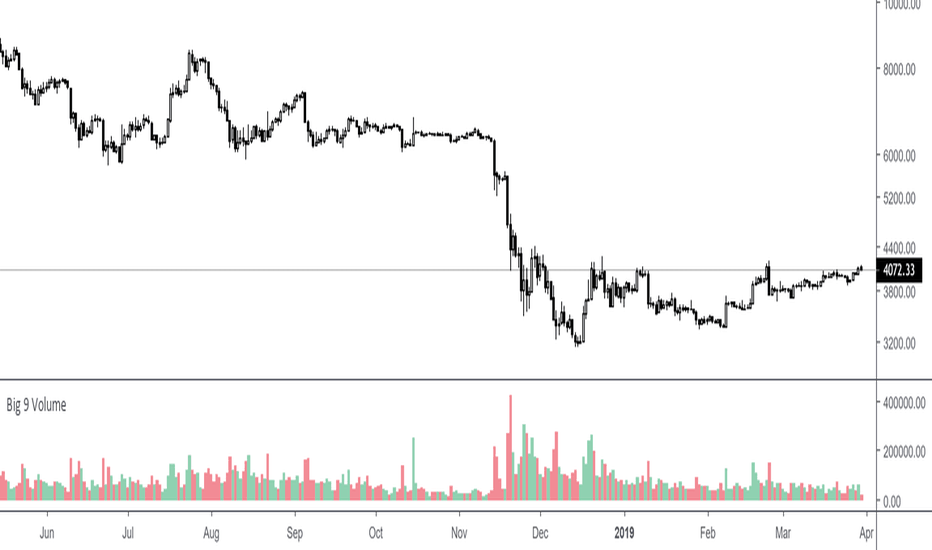
Here is a very basic indicator combining the volumes of the 9 biggest exchanges trading BTC/USD or BTC/USDT. These 9 exchanges were chosen based on the report by Bitwise Invest stating that 95% of the volume on CoinMarketCap is fake. On these 9 exchanges, however, volume data appears to be reliable. Please note BitFlyer was not included because it does not trade...
For any timeframe. Use for the BTC/USD pair. It is calculated by the formula: longs - shorts. Used data from Bitfinex. To smooth the values, you can use the EMA embedded in the indicator.
BTCUSD / ETHUSD Ratio. You might find patterns when to move from BTC to ETH and vice versa. # Open Source The code is open source @ github.com and uses the commonpine library github.com
Aggregates the Bitcoin volume from multiple exchanges into a single indicator. # Exchanges and Pairs Included are only exchanges supported by TradingView: * Binance * Bitstamp * Bittrex * Coinbase * Gemini * itBit * Bitfinex * Kraken * Poloniex * HitBTC * OKCoin * BitMEX Excluded low volume exchanges (not in CMC Top): * CEX.IO * Coinfloor Excluded low volume...
RSI Cross Explanation; It's simple, When short-term RSI crossover long-term RSI ; BUY ( Green Area ) When short-term RSI crossunder long-term RSI ; SELL ( Red Area ) You can change RSI lenghts or moving average lenght on settings. If you knew that, you would sell all your bitcoins at a price of $13.500 and not look back on 8th January. Happy trading.
Quantitative momentum trading strategy for BTC 12h (long and short).
A handy tool for those who need Multiple Moving Averages in a single indicator! A great collection of 8 very powerful EMAs and SMAs including: 50MA 9EMA 100MA 13EMA 200MA 26EMA 500MA 55EMA Of course, completely customizable to your own needs. No need to upgrade your Tradingview account...
Retail Exchanges Binance Bitstamp Coinbase Kraken Bithumb BitFlyer OkEx CEX Huobi Institutional Exchanges Bitfinex Bitmex The ratio measure the (total volume of retail exchanges) / (total volume of retail exchanges + total volume of institutional exchanges). Imperfect. Not investment advice. H/T @cryptorae for the original version.
A strategy based on ToFFF MACD DEMA indicator Even so , ı dont recommended using MACD DEMA alone. Combine its code with your favorite indicators. You can visit ToFFF's indicator :
RSI + STOCHASTIC RSI combination v2 ( for v1 ) For 5 min Changes Stcoh RSI creates signal with crossover RSI created signal with an equation ( above or below the line) ,crossover was added.
An update to: Made it into and indicator. v. 0.0.1 DESIGNED FOR DAILY CHARTS
Shows strength of the currently charted alt compared to BTCUSD. If BTC is going down or sideways and the alt is going up, then you'll see green and vice-versa for red. Good for quick at-a-glance strength evaluation when flying through a watchlist. The output uses a normalised moving average to reduce signal noise.


![Retail vs. Institutional Bitcoin Volume Ratio [@joemccann] BTCUSD: Retail vs. Institutional Bitcoin Volume Ratio [@joemccann]](https://s3.tradingview.com/4/4BlBcoAl_mid.png)


![XBT Volatility Weighted Bottom Finder. [For Daily Charts] BTCUSD: XBT Volatility Weighted Bottom Finder. [For Daily Charts]](https://s3.tradingview.com/h/HdSFR0RT_mid.png)

