Vector3Library "Vector3"
Representation of 3D vectors and points.
This structure is used to pass 3D positions and directions around. It also contains functions for doing common vector operations.
Besides the functions listed below, other classes can be used to manipulate vectors and points as well.
For example the Quaternion and the Matrix4x4 classes are useful for rotating or transforming vectors and points.
___
**Reference:**
- github.com
- github.com
- github.com
- www.movable-type.co.uk
- docs.
Indicators and strategies
Intraday Intensity ModesIntraday Intensity Index was created by David Bostian and its use was later featured by John Bollinger in his book "Bollinger on Bollinger Bands" . It is categorically a volume indicator and considered to be a useful tool for analyzing supply and demand dynamics in the market. By measuring the level of buying and selling pressure within a given trading session it attempts to provide insights into the strength of market participants' interest and their aggressiveness in executing trades througho
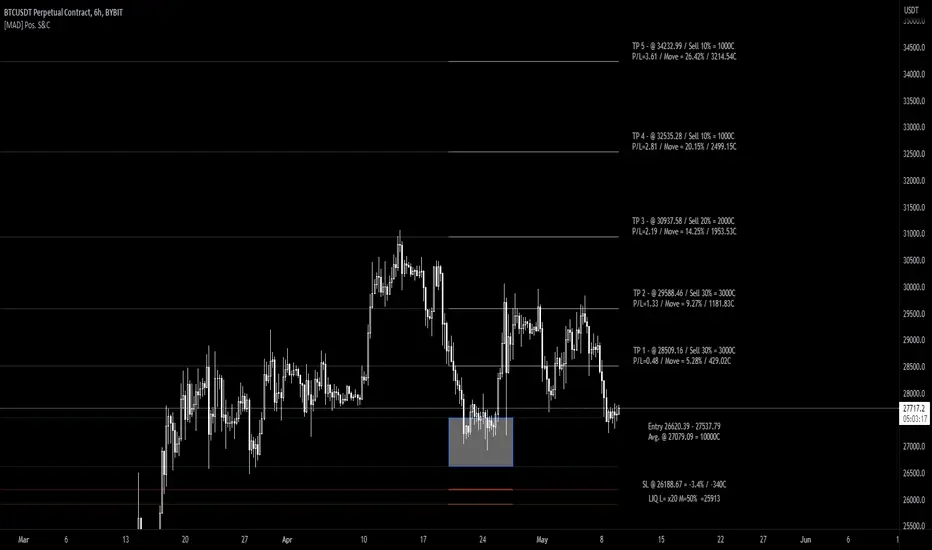
[MAD] Position starter & calculatorThe tool you're using is a financial instrument trading planner and analyzer.
Here is how to use it:
Trade Planning: You can plan your trade entries and exits, calculating potential profits, losses, and their ratio (P/L ratio).
You can define up to five target closing prices with varying volumes, which can be individually activated or deactivated (volume set to 0%).
Risk Management: There's a stop-loss function to calculate and limit potential losses.
Additionally, it includes a liquidatio
Seasonality [TFO]This Seasonality indicator is meant to provide insight into an asset's average performance over specified periods of time (Daily, Monthly, and Quarterly). It is based on a 252 trading day calendar, not a 365 day calendar. Therefore, some estimations are used in order to aggregate the Daily data into higher timeframes, as we assume every Month to be 21 trading days, and every Quarter to be 63 trading days. Instead of collecting data on the 1st day of a given month, we are actually treating it as
Cleaner Screeners LibraryLibrary "cleanscreens"
Screener Panel.
This indicator displays a panel with a list of symbols and their indications.
It can be used as a screener for multiple timess and symbols
in any timeframe and with any indication in any combination.
#### Features
Multiple timeframes
Multiple symbols
Multiple indications per group
Vertical or horizontal layouts
Acceepts External Inputs
Customizable colors with 170 presets included (dark and light)
Customizable icons
Cust
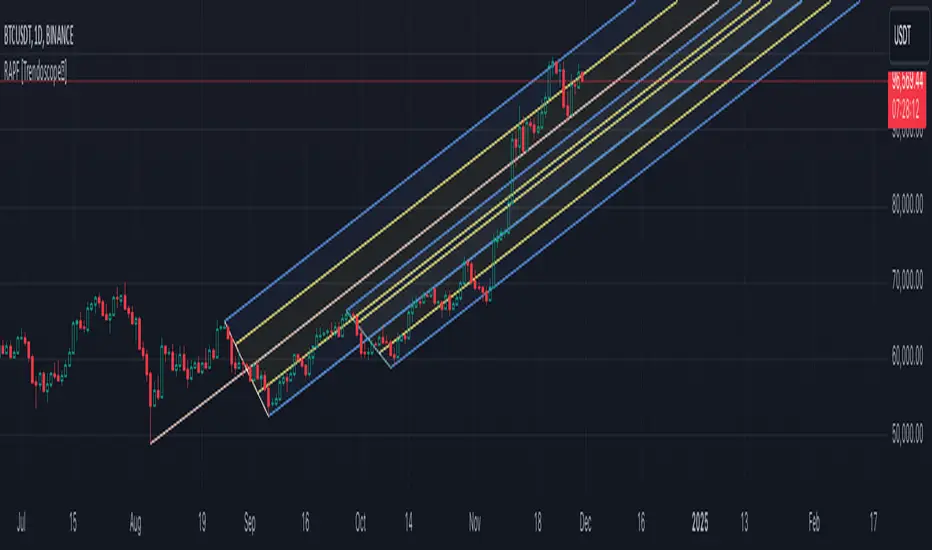
Recursive Reversal Chart Patterns [Trendoscope]Caution: This algorithm is very heavy and bound to cause timeouts. If that happens, there are few settings you can change to reduce the load. (Will explain them in the description below)
🎲 Recursive Reversal Chart Patterns Indicator
Welcome to another exploration of Zigzag and Pattern ecosystem components. Previously we derived Pitchfork and Recursive Zigzag indicators. This indicator is designed to scan and highlight few popular "Reversal Chart Patterns". Similar to other indicators in th
Simple Trendlines📈 Trendlines, made easy.
Simple Trendlines is a carefully made library that provides an easy and accessible way to draw trendlines on the chart.
Containing only 10 properties and 2 methods, the implementation is designed to be understandable through an object-oriented structure and provides developers the opportunity to expand without having to deal with slope calculation while also ensuring that there's no leakage between the trendlines before they're drawn.
Developers only need to provide
Sniffer
╭━━━╮╱╱╱╱╭━╮╭━╮
┃╭━╮┃╱╱╱╱┃╭╯┃╭╯
┃╰━━┳━╮╭┳╯╰┳╯╰┳━━┳━╮
╰━━╮┃╭╮╋╋╮╭┻╮╭┫┃━┫╭╯
┃╰━╯┃┃┃┃┃┃┃╱┃┃┃┃━┫┃
╰━━━┻╯╰┻╯╰╯╱╰╯╰━━┻╯
Overview
A vast majority of modern data analysis & modelling techniques rely upon the idea of hidden patterns, wether it is some type of visualisation tool or some form of a complex machine learning algorithm, the one thing that they have in common is the belief, that patterns tell us what’s hidden behind plain numbers. The same philosophy has been adopted by many traders & inve
ATR OSC and Volume Screener (ATROSCVS)In today's world of trading, having the right tools and indicators can make all the difference. With the vast number of cryptocurrencies available, I've found it challenging to keep track of the market's overall direction and make informed decisions. That's where the ATR OSC and Volume Screener comes in, a powerful Pine Script that I use to identify potential trading opportunities across multiple cryptocurrencies, all in one convenient place.
This script combines two essential components: the A
DataChartLibrary "DataChart"
Library to plot scatterplot or heatmaps for your own set of data samples
draw(this)
draw contents of the chart object
Parameters:
this : Chart object
Returns: current chart object
init(this)
Initialize Chart object.
Parameters:
this : Chart object to be initialized
Returns: current chart object
addSample(this, sample, trigger)
Add sample data to chart using Sample object
Parameters:
this : Chart object
sample : Sample object con
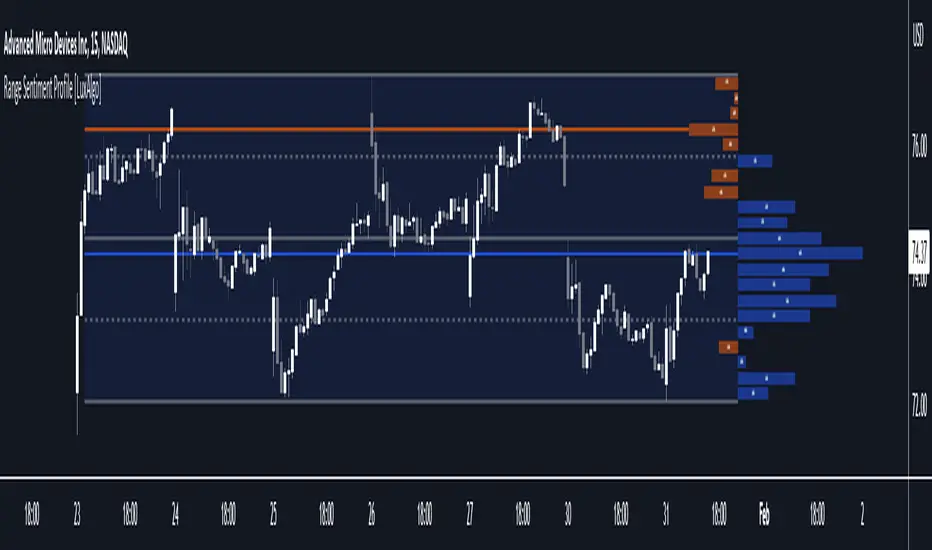
Range Sentiment Profile [LuxAlgo]The Range Sentiment Profile indicator is inspired from the volume profile and aims to indicate the degree of bullish/bearish variations within equidistant price areas inside the most recent price range.
The most bullish/bearish price areas are highlighted through lines extending over the entire range.
🔶 SETTINGS
Length: Most recent bars used for the calculation of the indicator.
Rows: Number of price areas the price range is divided into.
Use Intrabar: Use intrabar data to compute the
Intrabar Run Count Indicator [tbiktag]• OVERVIEW
Introducing the Intrabar Run Count Indicator , a tool designed to detect potential non-randomness in intrabar price data. It utilizes the statistical runs test to examine the number of sequences ( runs ) of positive and negative returns in the analyzed price series. As deviations from random-walk behavior of returns may indicate market inefficiencies , the Intrabar Run Count Indicator can help traders gain a better understanding of the price dynamics inside each chart bar an
3D Engine OverlayThe Overlay 3D Engine is an advanced and innovative indicator designed to render 3D objects on a trading chart using Pine Script language. This tool enables users to visualize complex geometric shapes and structures on their charts, providing a unique perspective on market trends and data. It is recommended to use this indicator with a time frame of 1 week or greater.
The code defines various data structures, such as vectors, faces, meshes, locations, objects, and cameras, to represent the 3D o
Adaptive Candlestick Pattern Recognition System█ INTRODUCTION
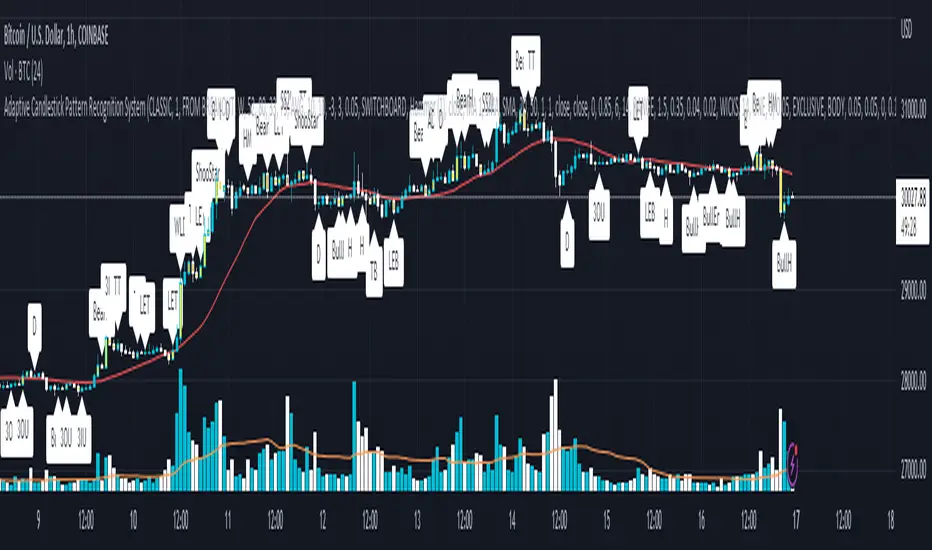
Nearly three years in the making, intermittently worked on in the few spare hours of weekends and time off, this is a passion project I undertook to flesh out my skills as a computer programmer. This script currently recognizes 85 different candlestick patterns ranging from one to five candles in length. It also performs statistical analysis on those patterns to determine prior performance and changes the coloration of those patterns based on that performance. In searching Tra
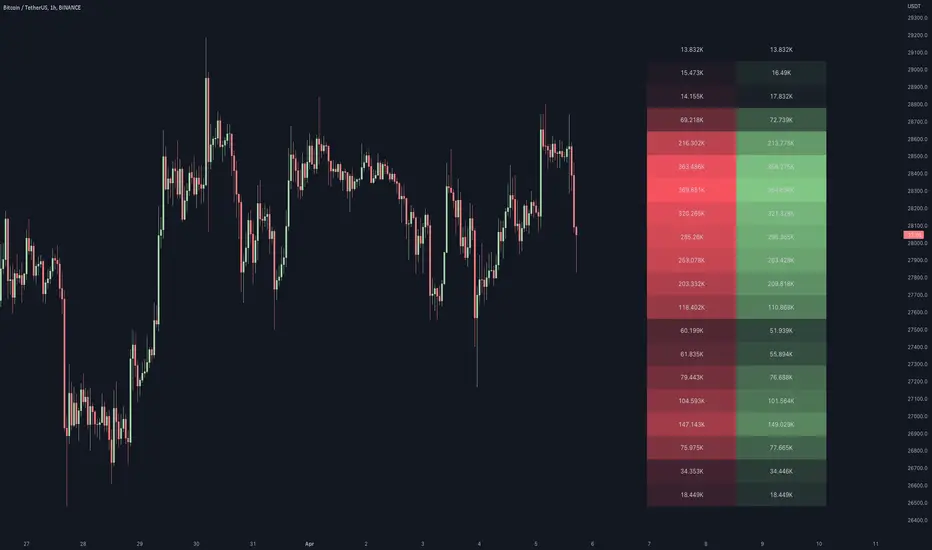
Volume / Open Interest "Footprint" - By LeviathanThis script generates a footprint-style bar (profile) based on the aggregated volume or open interest data within your chart's visible range. You can choose from three different heatmap visualizations: Volume Delta/OI Delta, Total Volume/Total OI, and Buy vs. Sell Volume/OI Increase vs. Decrease.
How to use the indicator:
1. Add it to your chart.
2. The script will use your chart's visible range and generate a footprint bar on the right side of the screen. You can move left/right, zoom in/zoom
Stochastic Momentum Index (SMI) of Money Flow Index (MFI)"He who does not know how to make predictions and makes light of his opponents, underestimating his ability, will certainly be defeated by them."
(Sun Tzu - The Art of War)
▮ Introduction
The Stochastic Momentum Index (SMI) is a technical analysis indicator that uses the difference between the current closing price and the high or low price over a specific time period to measure price momentum.
On the other hand, the Money Flow Index (MFI) is an indicator that uses volume and price to measur
Modified Mannarino Market Risk Indicator MMMRI MMRIModified Mannarino Market Risk Indicator MMMRI was developed by "Nobody Special Finance" as an enhancement to the original MMRI developed by Gregory Mannarino. The original and modified version were created as a way to gauge current level of risk in the market. This published indicator includes both versions along with ability to customize the symbols, denominators, and ratio factors that are used within their formulas. Additional options have been included to colorize the candles, plot, and lev
RedK EVEREX - Effort Versus Results ExplorerRedK EVEREX is an experimental indicator that explores "Volume Price Analysis" basic concepts and Wyckoff law "Effort versus Result" - by inspecting the relative volume (effort) and the associated (relative) price action (result) for each bar - showing the analysis as an easy to read "stacked bands" visual. From that analysis, we calculate a "Relative Rate of Flow" - an easy to use +100/-100 oscilator that can be used to trigger a signal when a bullish or bearish mode is detected for a certain u
Markdown: The Pine Editor's Hidden Gem💬 Markdown, a markup language
Markdown is a portable, lightweight markup language that can be used for everything whether you're building a website, documentation, or even presentations.
Platforms like Discord, Reddit, and GitHub support Markdown and is the widely go-to option for text formatting due to its simplicity. Pine Script is a language that also utilizes Markdown, specifically in the Pine Editor where it can really be used to some extent.
Since the release of libraries, user-defined
Elliott Wave [LuxAlgo]The Elliott Wave indicator allows users to detect Elliott Wave (EW) impulses as well as corrective segments automatically on the chart. These are detected and displayed serially, allowing users to keep track of the evolution of an impulse or corrective wave.
Fibonacci retracements constructed from detected impulse waves are also included.
This script additionally allows users to get alerted on a wide variety of trigger conditions (see the ALERTS section below).
🔶 SETTINGS
🔹 Source
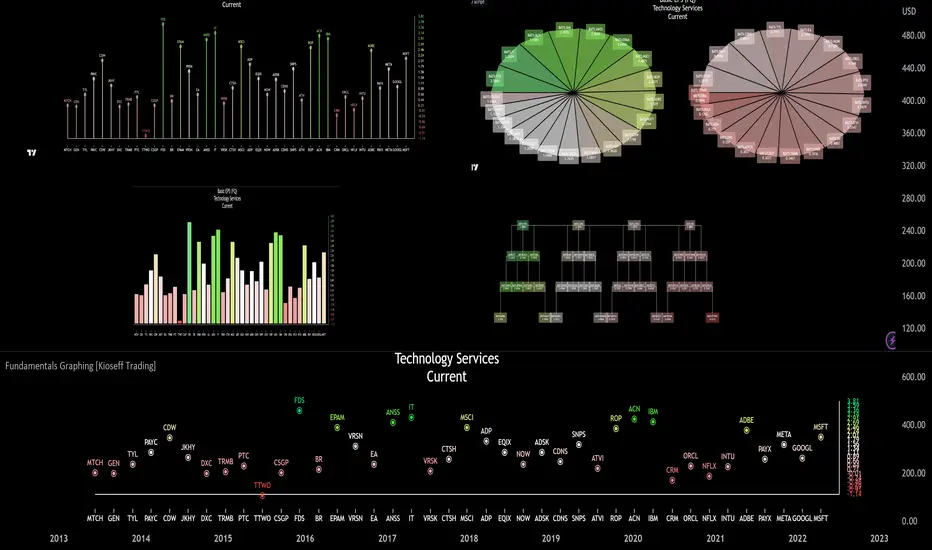
Fundamentals Graphing [Kioseff Trading]Hello!
This script "Fundamental Comparison" allows you to compare almost any fundamental metric across 40 assets; various charting methods are employable!
Thank you to @TradingView / @PineCoders for providing the framework in the "Financials on Chart" indicator - thereby expediting a generous portion of work (:
Features
Most metrics included in the "Financials on Chart" indicator are graphable
Scatter chat
Histogram
Bar chart
Pie chart
Reversible scaling
Adjusts to the size of yo
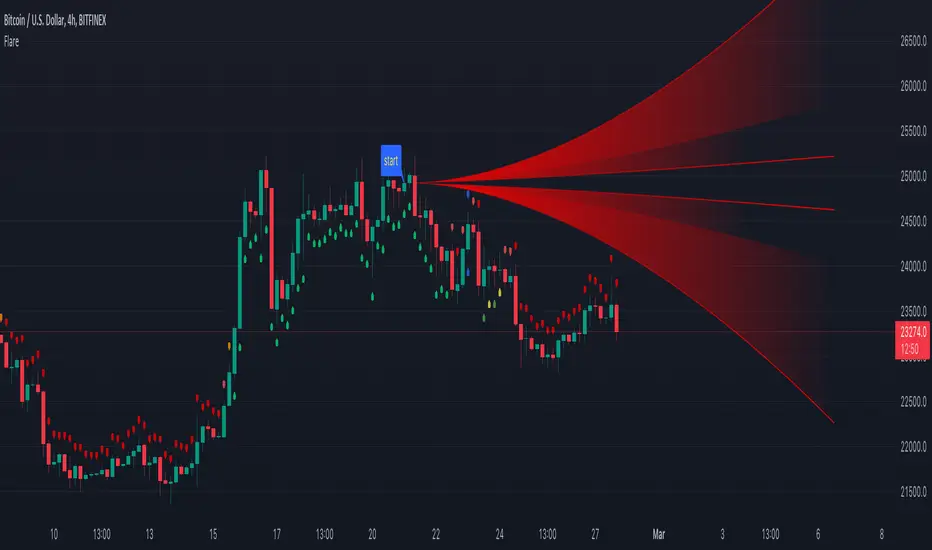
Flare🔶 METHODS
• Pine Script™ introduces methods ( 1 , 2 )! Much kuddos for the developers, Tradingview, and all who has worked on it!
• This educational script will show the simplified way of writing built-in methods, not to create a new method.
🔹 Simplified way of writing built-in methods:
· Instead of:
newArray = array.new()
array.unshift(newArray, 1)
lin = line.new(na, na, na, na)
line.set_xy1(lin, bar_index , close)
line.set_xy2(lin, bar_index + 10, close)
lab
Recursive Auto-Pitchfork [Trendoscope]"Say Hi" to object oriented programming with Pinescript using types and methods. This is the beginning of new era of Pinescript where we are moving from isolated scripts containing indicator and strategies to whole ecosystem of Object Oriented Programming with libraries of highly reusable components. Those who are familiar with programming would have already realised how big these improvements are and what it brings to the table.
With this script, I am not just providing an indicator for trader
Intrabar Analyzer [Kioseff Trading]Hello!
This indicator (Intrabar Analyzer) presents intrabar data in various derivative forms.
On-Chart Features
Traditional price data down to 1 min.
Heikin-Ashi price data down to 1 min.
Kagi price data down to 1 min.
Point & Figure price data down to 1 min.
Renko price data down to 1 min.
Linebreak price data down to 1 min.
LinReg channel
SMA
EMA
ALMA
Echomorphic Average (A @kaigouthro special!)
HMA
RMA
WMA
VWMA
VWAP
SWMA
SAR
Supertrend
On-Chart Features
Price