Indicators, Strategies and Libraries
The adaptive price zone (APZ) is a volatility-based technical indicator that helps investors identify possible market turning points, which can be especially useful in a sideways-moving market. It was created by technical analyst Lee Leibfarth in the article “Identify the Turning Point: Trading With An Adaptive Price Zone,” which appeared in the September...
The adaptive price zone (APZ) is a volatility-based technical indicator that helps investors identify possible market turning points, which can be especially useful in a sideways-moving market. It was created by technical analyst Lee Leibfarth in the article “Identify the Turning Point: Trading With An Adaptive Price Zone,” which appeared in the September...
The adaptive price zone (APZ) is a volatility-based technical indicator that helps investors identify possible market turning points, which can be especially useful in a sideways-moving market. It was created by technical analyst Lee Leibfarth in the article “Identify the Turning Point: Trading With An Adaptive Price Zone,” which appeared in the September...
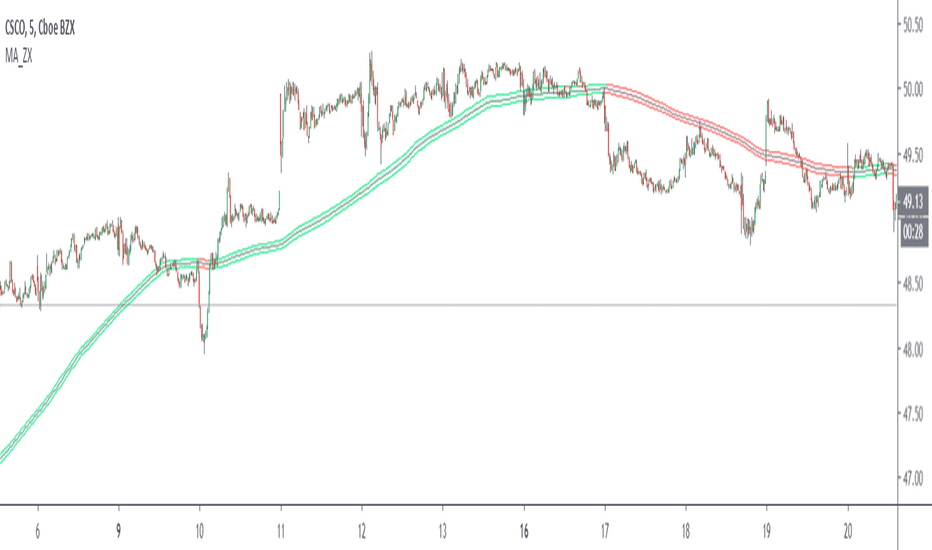
This indicator generates a zone for a moving average by means of the high and low source of the same average, the moving average should be worked as zones not as a line, by default a simple average of 200 periods is configured, the indicator has direction detection and represents it by the green and red colors, it also has padding with the same characteristic, it...
Extended Stochastic with All Zones. From Neutral to Danger Zones. The Most Complete and Extended Stochastic Indicator.
This simple script draws the previous higher timeframe candle high/low to your chart. You can also make the script paint the zone between the low/open and the high/close.
A script that draws supply and demand zones based on the RSI indicator. For example if RSI is under 30 a supply zone is drawn on the chart and extended for as long as there isn't a new crossunder 30. Same goes for above 70. The threshold which by default is set to 30, which means 30 is added to 0 and subtracted from 100 to give us the classic 30/70 threshold on...
This script allows you to set breakout alerts. An alert will be triggered only when price breaks and closes beyond the specified prices. You will get an alert on the first candle that closes beyond the levels you set.
This simple indicator paints the zone between up to 3 different Moving Averages and Exponential Moving Averages. For example: The green zone is the price between the 50 EMA and the 50 MA . The orange zone is the price between the 100 EMA and the 100 MA . The red zone is the price between the 200 EMA and the 200 MA .
This indicator paints the background of the chart between 2 EMAs when all 3 given EMAs are in sync. The default settings are: Long-term EMA: 200 Period. Short-term EMA 1: 50 Period. Short-term EMA 2: 20 Period. So according to the default settings, when the 20EMA is above the 50EMA, and the 50EMA is above the 200EMA, the area between the 20EMA and the...
" Volume Precedes Price is the conceptual idea for the oscillator." "The main idea of the VZO was to try to change the OBV to look like an oscillator rather than an indicator, also to include time; primarily to identify which zone the volume is located in during a specific period " How to read this indicator: Positive reading -> bullish Negative reading...
This tool highlights where gaps happens and outlines in the chart where the gap zones are. If there is a gap up there is a green line, a gap down it is red. The gap zone is highlighted in blue. You can choose the size of your gap with the input menu to the desired size. Feel free to ask comment below. Made for the Gold Minds group
This indicator is basically just a back-testing tool. All it does is highlight the background of your charts with the specified color within the specified timezone. This is useful particularly for back-testing purposes, such as testing a day-trading strategy within a particular period of the day or ignoring signals that fall within the given timeframe (which is...
This is a dynamic structure indicator designed to map potential support and resistance zones (in all markets). It does this by looking back x amount of candles to identify major swing highs and lows on the specified reference timeframe, and then it draws a zone between the highest/lowest wick and the highest/lowest candle close across the chart until a new zone...
Regular script to allocate the specified time range within a day. TradingView in time is specified by UTC. I Moscow time (GMT +3) and the time specified in the script Default 1:00 - 13:00 Moscow time equal 09:00 - 21:00 ie -8 Hours from the Moscow time (-7 in summer). ========== ========== Обычный скрипт для выделения указанного диапазона времени внутри...
Support and Resistance using donchian channels to validate tops/bottoms (note: while donchians follow price closely within look back window, this will only update new top/bottom when making new extremes in the donchian channel) combo with other systems:


![Volume Zone Oscillator and Price Zone (VZO/PZO) [NeoButane] FB: Volume Zone Oscillator and Price Zone (VZO/PZO) [NeoButane]](https://s3.tradingview.com/y/YFUS4pfN_mid.png)


![[RS]Support and Resistance V0 EURUSD: [RS]Support and Resistance V0](https://s3.tradingview.com/j/JWdq2Bni_mid.png)
