How the Score is calculated in The Leap
Instead of realized profit, some Leap competitions rank participants by Score, considering not only the outcome, but also the max drawdown % — the largest drop in your equity from a peak to a subsequent low, whether from closed or open positions. To see which scoring system applies, check the Rules and Terms of your competition.
What is the Score?
This determines a participant's place on the leaderboard, balancing profit against risk.
Score = Realized profit % / Max drawdown %
Realized profit is the profit or loss on closed positions, counted as a percentage of the starting balance.
Max drawdown is the largest decline in account equity, including open positions, expressed as a percentage of its highest point during the competition. Equity is measured at regular intervals, so moves between two checks are not counted.
If the max drawdown is between 0% and 5%, it is counted as 5%. For instance, if your max drawdown is 2%, it is still counted as 5%.
Why small drawdowns count as a fixed minimum
On the leaderboard, this rule appears as "Max drawdown under 5% counts as 5%".
At that level, a drawdown usually reflects ordinary market movement rather than the risk a trader chose to take. The Score is meant to separate participants by meaningful risk, so below the minimum everyone is treated equally and realized profit decides the place. Above it, drawdown counts in full.
The rule doesn't reward a large drawdown. It keeps normal volatility from affecting where you finish.
Note: The minimum is set separately for every competition using the Score. The drawdown value is not fixed across The Leap competitions. It depends on what you trade, since asset classes differ in how much they move on a normal day. Always check the Rules and Terms of the competition you joined.
Leaderboard calculation example
Let's take for example a competition where the "max drawdown under 5% counts as 5%" rule is applied.
Trader B made the most money and still finished behind Trader A, because A got there with the drawdown that is two times less.
Where to find your numbers
Competition page
Your participant card at the top of the leaderboard shows your Place, Score, Realized profit, and Max drawdown. The leaderboard below uses the same columns for every participant, so you can compare yourself with the traders above and below you.
Account Manager
In your competition account, the Analytics tab shows Max drawdown in Key stats and your equity curve, with a switch between Equity and PnL. Equity is shown by default and includes open positions, which is the same basis your max drawdown is calculated from.
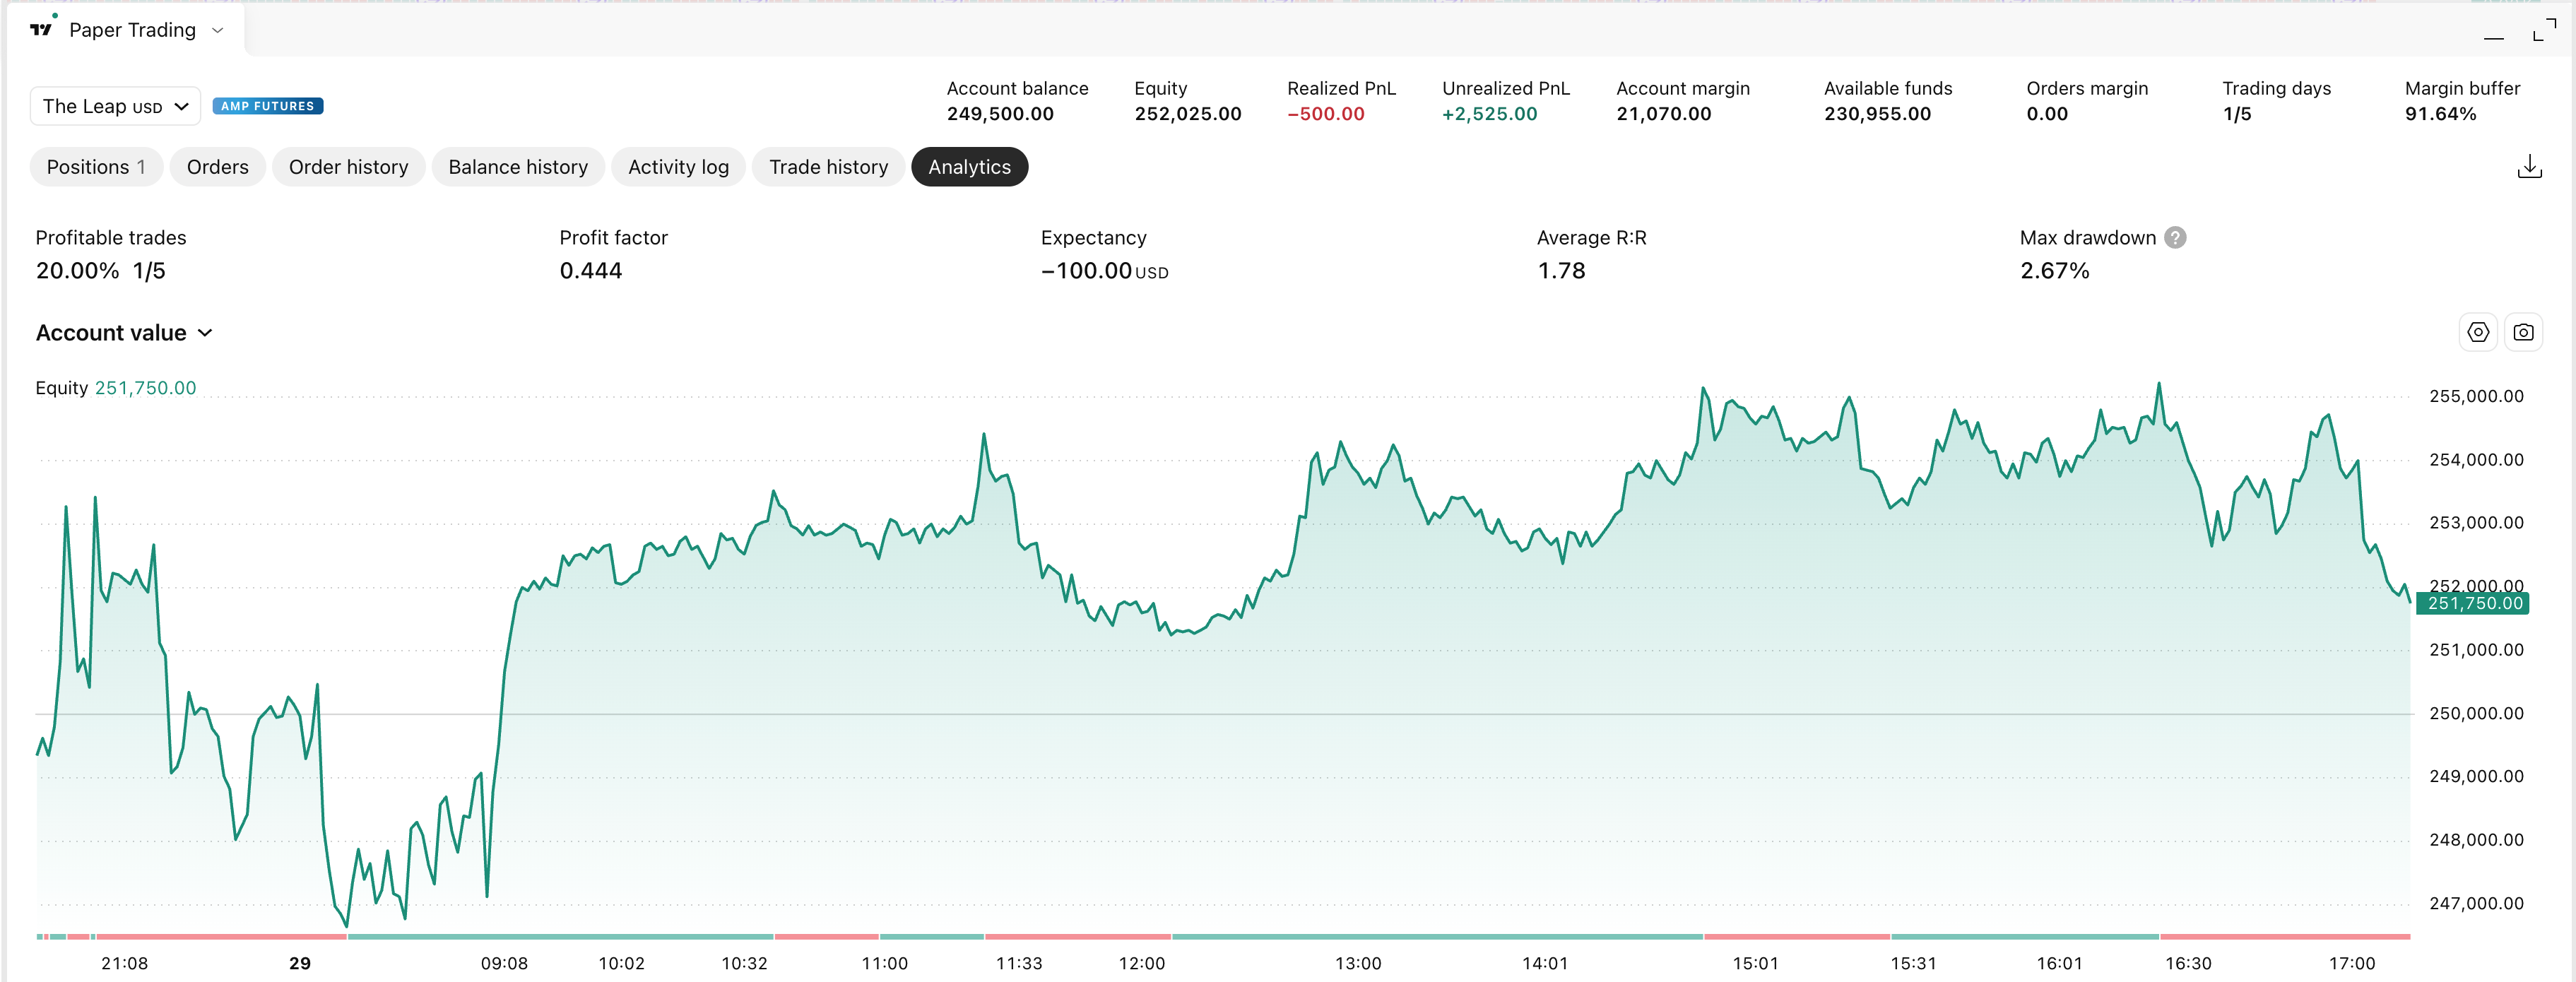
Key stats tell you where you stand, the curve tells you when the drawdown happened and why.