AVAXUSDCertain candlestick patterns can offer immediate clues for potential reversals, though they are best used with other indicators. Examples include the Evening Star pattern.
Trade ideas
avaxusdCertain candlestick patterns can offer immediate clues for potential reversals, though they are best used with other indicators. Examples include the Evening Star pattern.

AVAXUSD Good Long @23.4-23 rangeAVAXUSD made a good base around 23 level. It acted as a Strong support from past falls. Now again when some correction happening we will go long on AVAXUSD from 23 range.
Entry - 23.4-23 (Accumulation zone)
Target - 24.3,25,29
SL - 21

AVAX Price Retests Ascending Channel Pattern's Lower Support Tre
Since August, AVAX has followed a pattern of higher highs within an ascending wedge, breaking free from a previously dominant downtrend. However, amid recent market volatility, AVAX has shown a persistent downtrend, with a 3.10% drop in the past day and an 8.70% decline over the week. Over the last month, the token fell nearly 10%, bringing its year-to-date loss to 41.60%.
Currently, AVAX finds support near the $25 level and the lower edge of its ascending wedge. A break below these levels could lead to a significant downturn. If market uncertainty intensifies, AVAX may retest its $24.30 trendline, and in a bear-driven Q4, it could fall further to key lows around $20 and $17.
On the upside, a bullish reversal could see AVAX retesting resistance at $33.06 this month, potentially signaling a successful Change of Character (ChoCh). Should bullish momentum persist, AVAX could climb to higher resistance levels of $39 and $49 in the coming sessions.

Whats Ahead For AVAX Price On Daily Technical Chart?
On October 12, news of the buyback propelled AVAX above the 200-day EMA from a crucial demand zone. With the overall market sentiment, bolstered by Bitcoin's performance turning bullish, the entire crypto landscape is seeing a surge in green.
Bitcoin is currently nearing the $65,000 mark after a quick rebound from the $64,000 support level, which has improved market conditions and boosted optimism for AVAX. In Q3, AVAX briefly broke above the upper boundary of a wedge pattern, but the breakout lacked strength and led to a period of sideways consolidation alongside several EMA bands.
As of now, AVAX is approaching the $33 mark, which represents a critical change of character (ChoCh) level. Successfully clearing this resistance could significantly enhance long-term bullish sentiment. However, if it fails to break through, the price may settle back toward the nearest support level around $25.

AVAX has seen a significant decrease in value, plummetingAvalanche (AVAX) Technical Analysis On 1-D Chart?
AVAX has been experiencing a notable downtrend, indicating a strong presence of sellers in the market. This prevailing negative sentiment suggests that further declines in price could be on the horizon, raising concerns among investors and traders.
In recent months, AVAX has seen a significant decrease in value, plummeting from a peak of $65.35. This downward movement has led the cryptocurrency to break through crucial support levels, reinforcing its bearish trend.
Nevertheless, there is still a glimmer of hope for recovery. If AVAX manages to break through the $32.75 resistance level and maintain its position above it, it could initiate a robust upward trend.
Such a breakout could potentially signal a reversal of the current downtrend, attracting more buyers and potentially shifting market dynamics in favor of AVAX.

Finding What AVAX Price Structure Could Display Next?AVAX displayed a bullish presence over the past two weeks, when BTC sustained by July 5th onwards on the daily, and the crypto-landscape resonated green. As of writing, it presents the possibility of continuing its upward trajectory or breaking from a bullish pattern, precisely the falling wedge from the demand zone of $22.0.
The AVAX had a gripping price action after the prolonged consolidation that ended December 2023 on the daily chart. The price displayed the effectiveness of the resistance-turned-support $22, from where the price has taken a bounce in the past two weeks.
With the broader market bullish sentiments on the chart, as BTC is on the rise and has a correlation of 0.73, many are optimistic about AVAX. In the past 17 days, the gains were more than 45%, as it followed BTC's lead on the daily chart. Technically, The price surpassed the 50-day EMA band and has traded near the 200-day EMA band, which could be surpassed contingent on buyers' interest.
MACD displayed a bullish crossover, with a histogram growing at 0.0.83, and the RSI flashed at 65.24, indicating bullishness.
Therefore, if the price continues surging, the following resistance levels are at $37 and $50. However, failing jump resistances would lead to a price decline, and the bears would look at the nearest supports at $27 and $16, respectively.

Avalanche Crypto Takes Rebound: Is AVAX Poised For A Reversal?Avalanche Crypto Takes Rebound: Is AVAX Poised For A Reversal?
Avalanche crypto reversed near the $24 level and surged nearly 7% from the previous day's low.
At the time of writing, the AVAX crypto was trading close to $25.70 marking a 2.35% rise in Intraday.
Avalanche crypto gained traction after the bulls defended the price above the recent support of $24 and resumed its recovery on the second day. At the time of writing, the AVAX crypto had made a breakout above the previous day's high and was up over 2.5% today.
Moreover, the weakness in the broader market triggered a sharp selling in the AVAX crypto. However, the intraday recovery has added some relief to the investors. Moreover, the AVAX price recovery needs to last longer in order to claim a bullish territory as the price currently hovers below the key EMAs.
Also, there has been a significant development in the transaction volume which indicates the continuation of a recovery. Let's analyze combining all the metrics and try to draw a clear picture of where AVAX could proceed next.
Avalanche Crypto Volume & Volatility Analysis
The bears attempted for a breakdown below the recent support of $24 yesterday, however, the bulls made a comeback in the later session and price closed higher thus defending the support. Moreover, the intraday movement reveals the domination of buyers headed for a recovery.
Moreover, along with the price recovery, there has been a significant development in the transaction volume. The intraday transaction volume has dropped by nearly 40% and was at $322 Million a day. The drop in transaction volume reveals the waning interest of the sellers.
Moreover, the volume to market cap ratio was 3.25% indicating low volatility in the crypto. It has a live market capitalization of $10.19 Billion and ranks 12th in the cryptoverse.
AVAX Crypto Technical Analysis
From a technical standpoint the AVAX crypto hovers below the key Exponential moving average of 20, 50 and 200 days indicating a strong bearish trend prevailing. Though the bulls have initiated a recovery, it needs to surpass the 200 day EMA in order to turn a bullish reversal .
On the higher side, the $33.5 level may act as a hurdle which if surpassed may validate a bullish reversal. On the lower side, the $24 level has been acting as the critical demand zone which if breached may trigger a panic selling in the crypto.
At the time of writing, the RSI line and 14 day SMA line have made a bullish crossover adding confirmation to a continued recovery. Both the lines have recovered from an oversold region indicating an improved sentiment.
Can AVAX Continue To Recover Or Fail?
Avalanche crypto surged 2.5% intraday today after defending the $24 support level indicating a recovery. Despite broader market sell-offs, AVAX price recovery has reassured investors. However, for a bullish reversal, the price must sustain above the key EMAs.
Currently, AVAX hovers below the 20, 50, and 200-day EMAs, signaling a bearish trend. Transaction volume has decreased by 40%, indicating decreased selling pressure. Now, if AVAX crypto manages to surpass the $33.5 resistance, a bullish reversal could be confirmed. However, falling below $24 could lead to further sell-offs. The RSI and SMA lines suggest improving sentiment.

A big Move to Come In AVAX Ahead!
After a long spend time in a contracted falling wedge, the price last traded near the previous resistance turned support and showed 8.37% intraday growth, where the price traded at $28.03.
Its market cap has grown to $11.039 Billion, which has positioned it as the 11th-ranked crypto in the global top 100 cryptos based on its market cap. However, the liquidity is moderate, but the price shows its desire to break out of this range sooner in the coming sessions.
AVAX surpassing the wedge could lead to capturing the lost territories back, starting with $37 and 50 at first. The AVAX price looks approaching dynamic resistance from below, signifying growth is coming. Meanwhile, oscillators like mACD have formed a bullish cross in bearish territory, displaying bears' dominance reducing gradually. RSI flashed at 43.13, which has taken support from 14-SMA and has recovered from oversold.

AVAX asset price risesThe Avalanche cryptocurrency has experienced a 7.10% increase in the last 24 hours, trading at $33.81 at press time. The technical indicators are bearish, but there are minor bullish signs appearing in the MACD as it has converged for a bullish cross and the RSI at 44.18. Therefore, despite the bearish indicators, the situation could also turn to the upside.
If demand for the AVAX asset price rises, it could bounce back from the current level. The next price targets could be $40.0 and $50.0. However, if the AVAX crypto price fails to stay above the $30.0 level, it could decline further.

Avalanche Technical Tools And Performance AnalysisAVAX, the cryptocurrency of Avalanche, is facing resistance at $35 and has shown resilience despite market turbulence. It has declined by 6.18% in the past 24 hours and has a market capitalization of about $12.58 billion, placing it at the 12th position among cryptocurrencies. This decline in market capitalization indicates a decrease in interest in Avalanche, although the broader market has also been challenging.
Avalanche Crypto Daily Chart Overview
On the daily chart, Avalanche's price structure shows a battle between the bulls and the bears.
During the first week of November 2023, the bulls had the upper hand and drove the price up from the demand zone at $11.0 to $65.0 by March 18th, breaking through resistance levels at $27.0 and $50.0 along the way.
However, after reaching the top supply zone, Avalanche's price began to deteriorate, plummeting from a crucial level of around $65.0 on March 20th, 2024.
Following the declining wedge, the AVAX crypto suffered a significant plunge after touching the resistance supply level and fell to lower levels.
Avalanche Technical Tools And Performance Analysis
Despite a significant decline, the AVAX asset still shows bearishness and falling capacity as it slides below the considerable trend in the 20-day and 50-day EMA bands. If sellers continue to surge, the drastic decline could extend even more.
MACD is below the zero line in a bearish domain, and the RSI is falling steadily at 36.17, indicating that the AVAX asset is not gaining steam and can continue to drop lower.
The AVAX asset reveals bearish signs and may sink even lower, with negative price performance recorded in the previous week and month at -14.64% and -36.81%, respectively, indicating a steady downward trend.
AVAX Price Levels to Watch
Breaking above the resistance level of $35.50 could potentially pave the way for AVAX to reach higher resistance around $40.00. On the other hand, if the token falls below the support level of $30.00, it may face pressure to drop even further to the lower level of $25.00, which introduces risks of additional declines.
Traders need to monitor the key resistance and support levels since a breakout or breakdown could influence the short-term market direction, defining the potential movement boundaries for Avalanche.

The price of Avalanche appears to be decreasing latelyThe price of Avalanche cryptocurrency has been increasing, since October 2023 and it has seen a significant rise from $9.0 to $65.0 by March 18th, 2024. Avalanche has had a very positive six-month and three-month period, with gains of 316.03% and 4.58% respectively. However, in the last week and month, there has been a decline in the price by -15.84% and -30.41% respectively, indicating a strong downtrend.
However, Avalanche crypto has revealed a massive slump in price in the last couple of sessions and the price shows struggling signs of bulls and bearish dominance is extremely high. Contingent on seller's pressure, the massive drop could shatter more support and could target $35.0 and $28.0 support on the daily chart.
The price of Avalanche appears to be decreasing lately, following a sharp bearish pattern, as it broke below both the 20-day and 50-day EMAs' dynamic supports. This suggests that, based on the extent of selling pressure, there is a substantial likelihood of experiencing further drops.
Furthermore, the Avalanche crypto asset could accelerate this ongoing bearish trend, if the price slips more of its ground support, and coincidingly the MACD has started to decline abruptly from the zero line which is at -2.15 and has cut the signal line sharply from above.
Meanwhile, the RSI is at 32.70 and has moved lower after beating the 14-SMA from above like a falling knife, a push from the bear side could accelerate more deterioration.
AVAX Price Forecast
At the time of publishing, the Avalanche crypto is at $38.63 and shows an intraday decline of -1.83%.
Therefore, if the Avalanche crypto fails to maintain the $35.0 price level, the price could show a spectacular drop. However, if the price manages to show a resurgence, the price could break out coin the upside and reach $50.0, and $55.0.

Avalanche Price Forecast: Can AVAX Make Comeback And Shine AgainThe Avalanche price made a breakdown below the 20 day EMA suggesting weakness.
The AVAX crypto was trading close to $47.39 reporting a positive intraday development of 4.59%.
The Avalanche price jumped nearly 4.59% in Intraday and is recovering losses on Saturday. The bulls are attempting to regain control over the trend and reclaim their dominance above the 50 day exponential moving average.
The recent sessions saw a sudden fall due to profit taking as the price loomed downwards after a consolidation near the highs. The selling pressure received was backed by momentum due to which the 50 day EMA could not hold the price and a breakdown was noted on the charts.
However, the bulls seem to be aggressive in Intraday and have recovered nearly 4.59% and may reestablish themselves above the 50 day EMA if the momentum continues. The long term trend outlook is still bullish due to which it may attract the short term traders and investors at a discounted price.
Now, the Avalanche crypto may resume on the higher side again if the price bottoms out near the 50 day EMA. The buyers need to establish their presence at the lower levels to prevent the further fall and reverse its course.
Avalanche Crypto Development Activity Insights
The developer activity and developer activity count suggest the updates and changes undergoing in the AVAX crypto. The developers activity curve displayed the formation of a positive trajectory in February and March month suggesting a healthy development in the crypto.
The developers activity contributors count was 22 by the end of February. However, the developers count decreased in March month and dropped back to a count of 11. The 50% drop in the developers count slowed the development activity and a bearish curve was observed in the last month.
Open Interest Contracts Noted a Significant Profit booking.
As per Open interest vs AVAX price chart, the Open Interest contracts were 222.56 Million USD in the 1st week of February. The OI data saw a continuous growth in February and March. The number of open contracts reached 540.2 Million USD in the third week of March. The Avalanche crypto price also went parallely and experienced a growth of nearly 80%.
However, there has been a significant drop in the number of OI contracts in the last couple of weeks. Correspondingly, the AVAX price has noted a decline of nearly 20% in the period.
AVAX Crypto Sentiments Analysis
As per the santiment website, the negative sentiment was dominating till the January end. However, the weighted sentiment jumped over the zero line and turned positive in February. The AVAX price noted significant growth in the period.
The weighted sentiment curve dropped in the last couple of weeks and has fallen back towards the zero line. The overall sentiment has turned neutral as per the sentiment data.
Avalanche Price Prediction April 2024.
The Avalanche price prediction for April 2024 shows that the crypto may advance to a high of $70.8 if buyers are able to surpass the hurdle of $61.20 on the higher side. Whereas, the less optimistic analysts estimate a price target of $38.9 on the lower side after the breakdown below $44.47.
Conclusion.
The AVAX crypto has initiated a recovery after registering a fall of over 20% in the last couple of weeks. The price is up nearly 4.59% in Intraday and might show more gains by the session end. The bulls are attempting to reclaim their dominance above the 50 day EMA in order to keep the trend in their favor.
The long term trend outlook is still bullish above the 200 day EMA and might attract more buyers at a discounted price. Now, the bulls establish themselves near the 50 day EMA, then the upside trend may resume again.
Technical levels:
Support levels: $44.47 and $38.90.
Resistance levels: $61.20 and $70.08.
Disclaimer
The views and opinions stated by the author, or any people named in this article, are for informational purposes only and do not establish financial, investment, or other advice. Investing in or trading crypto or stock comes with a risk of financial loss.

price action shows that the price is trying hard to sustainThe Avalanche price shows that the price rose from $10 and hit the previous supply at the $50 price mark by last week December 2024. The price thereafter lipped some points and formed a new support of $27 by the last week of January in the new year 2024.
However, the crypto showed a fabulous resurgence on this level, which took the price all the way up to $65 by jumping over the previous supply level.
The recent price action shows that the price is trying hard to sustain above the previous supply of $50 price level on the chart, which shows possible signs of accumulation of buying interest over the daily chart for more futuristic growth in the coming sessions.
The Avalanche asset is also exhibiting bullish potential, as the price is above the dynamic supports of 20-day and 50-day EMA bands, MACD is above the zero line at 3.31, and RSI is above the 50, these circumstances highlight that AVAX price is in the bullish zone and has not lost the steam yet, and could possibly jump more from the current price level support.
Therefore, if the price manages to successfully hold on to its current price level support, the next target could be $70, and beyond that will open a gate for new opportunities to come in the price levels.
But on the different side, there is a negative possibility, that if the price decreases beneath the previous supply, that is $50 price mark, a downtrend can begin, which will start to consume its earned gains over the daily chart.


Avax USD upside move possibleAvax USD upside move possible
Buying above the 13.2001055
Stop loss 12.8110522
Target 14.9943562

AVAXUSD upside move possibleAVAXUSD upside move possible
Buying above the 14.1637561
Stoploss 13.3131599
Target 16.7579504

[AVAX] in a strong Demand zone..👀 Bullish move incoming?..💎Support Zone: AVAX has reached a significant support zone, where buying pressure has historically been strong. This zone provides a foundation for potential price recovery.
💎Positive Market Sentiment: The overall market sentiment towards AVAX is positive, with growing interest and demand from investors. This positive sentiment can contribute to a potential upward movement in price.
💎Fundamentals: AVAX has a strong underlying technology and ecosystem, which can attract investors and contribute to its potential recovery. Additionally, any positive developments or partnerships can further enhance its prospects.

LONG AVAXUSDTThere is good Opportunity for longing of AVAX in the area of 50 % and 60% Fib retracement level.
The reasons for this trade:
1- Clear break out of Resistance level with with good volume.
2- The has become above the 200MA of 4 hrs.
3- The Feb levels is making confluence with retest of resistance level.
Entry points are: $14.5 and $14
Stop loss: $13.5
Target : $20

Cup and handelAre these a cup and handle formation??
Avax is showing a formation of the inverted cup and handle formation in a daily time frame.
looking for a short opportunity.

#AVAXUSDTREASON
1)DOWNTREND
2)GOOD SUPPLY AND DEMAND
DOWN
1) in a DOWN trend
2) In Breakout
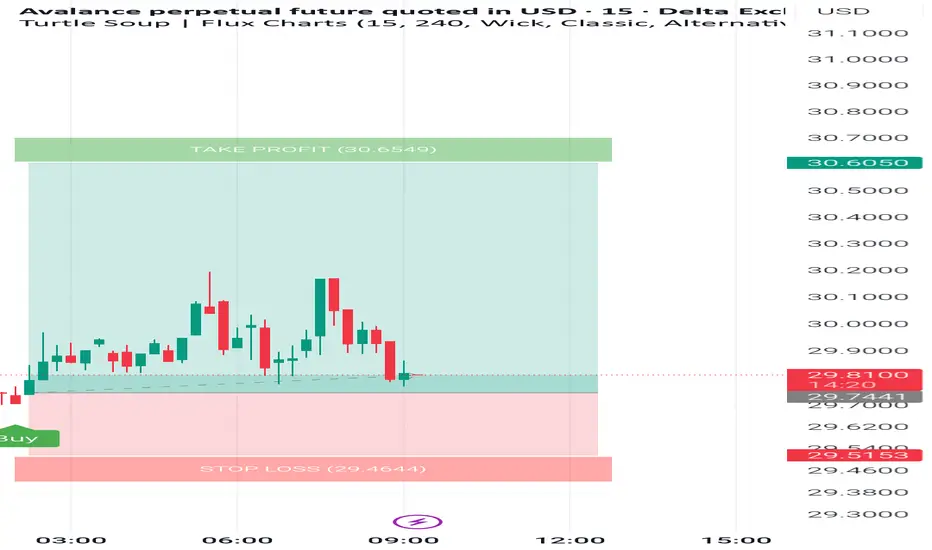
3) High Volatile#AVAX/USDT
Signal Type: Short
Leverage: Cross 20x
Entry Targets: 29.95 30.20
Take-Profit Targets:
1) 29.870
2) 29.780
3) 29.650
4) 29.500
5) 29.250
6) 29.000
7) 28.700
8) 28.200
Stop-Loss: 30.5
TRADE WITH YOUR OWN RISK

avax ideaas we can see sasccording to price action . the seller takes place rn for correction . which is must according to ellotie wave theory . so we can seethe berrish here if not its sl is very lessso its a good trade according to my analysis i hope you mist get idea i had evplained it as a small digram over chagood money guys and remember every loss is a good loss for future big gains .

AVAX/USDT H&S Pattern AVAX/USDT made a clear Head & Shoulder pattern. This can give a good long opportunity.
