Goodluck India Is Preparing For A Powerful ExpansionThe stock is showing a very interesting structure on the weekly chart. For almost 3 years the stock has been moving inside a broad ascending channel where every major correction has attracted buyers near the lower trendline while the upper trendline has repeatedly acted as resistance. What makes the current setup interesting is that price has gradually started forming higher highs and higher lows with strong buying momentum. Earlier attempts to cross the upper boundary faced rejection but this t
Goodluck India Ltd.
No trades
No trades
In-depth trading ideas
Goodluck India cmp 537 Daily ChartGoodluck India cmp 537 Daily Chart
- Support Zone 475 to 525 Price Band
- Resistance Zone 540 to ARH 537.35 Price Band
- Bullish Cup & Handle by Resistance Zone neckline
- Price trending well along the Rising Support Trendline
- Volumes seen in good sync with average traded quantity
- Breakout been attempted from falling Resistance Trendline
GOODLUCK: Textbook Cup & Handle Completion and Macro Breakout1. The Macro Perspective: The Deep Washout and Recovery
I am taking a LONG bias on Goodluck India Ltd. (GOODLUCK) on the weekly (1W) timeframe.
When analyzing a stock in a massive secular uptrend, we want to see healthy, deep consolidation phases to ensure the longevity of the move. Months ago, GOODLUCK established a major historical ceiling right at the 1,313.50 level. What followed was a brutal, highly volatile correction that successfully washed out late, over-leveraged buyers, dragging the
GOODLUCK - 2-year CONSOLIDATION DONE?DISCLAIMER: This publication is NOT a trade recommendation but only my observation. Please do your own analysis before taking your trades
Points to note:
-----------------
1.Price has been consolidating a Cup & Handle Pattern since 2 years.
2.A Cup & Handle is a Continuation pattern with Higher highs and higher lows, as seen in the chart
3.Price broke out of the pattern and is nicely sustaining above the neckline
4.Target will be the pattern height of the pattern
--------------------------
Goodluck India on the watch for a breakout Long ascending channel and consolidation right under the upper line of the channel . With the defence export ramp up and capes expansion, I feel breakout is about the corner . Will add small position on Monday and Placing GTT at 1300 and waiting for target of 1450 +
Disclaimer : I am not a SEBI researched analyst . Views are for learning purposes only . Not a Buy /sell recommendation.
GOODLUCK INDIA – Inverse Head & Shoulders Breakout in Progress!!Goodluck India has formed a textbook Inverse Head & Shoulders pattern on the weekly chart — one of the most reliable reversal patterns in technical analysis.
The structure is clean. Left shoulder formed around ₹1,200, the head dipped deeper to ₹650 making the lowest point, and the right shoulder bounced back near ₹1,000 — perfectly symmetrical. The neckline connecting the two shoulder highs sits around ₹1,300–1,400, and this week the stock is breaking above it with a powerful +11.99% candle and
Goodluck India Ltd. (Weekly Chart)Trend
Weekly candles are showing strong bullish momentum with higher volumes (suggesting institutional buying).
Sustained closing above ₹1,325 could trigger a fresh breakout, opening upside targets toward ₹1,450 – ₹1,500.
⚠️ Risk Factors
If the stock fails to sustain above ₹1,300 levels, profit booking may pull it back to ₹1,190 – ₹1,050 zone.
Broader market sentiment (Nifty trend) will also play a role in sustaining higher levels.
🎯 View
Bias: Bullish (Short to Medium Term)
Key Trigger
Goodluck swing500% big volume after price fall and quickly recover , now look like maybe sustain and move upside,
Here i just look
Huge volume
But price move , after profit booking, then fast way recovery.
And some News for affect in short to midium term
Sbi mutual fund bought that time , and some defences news
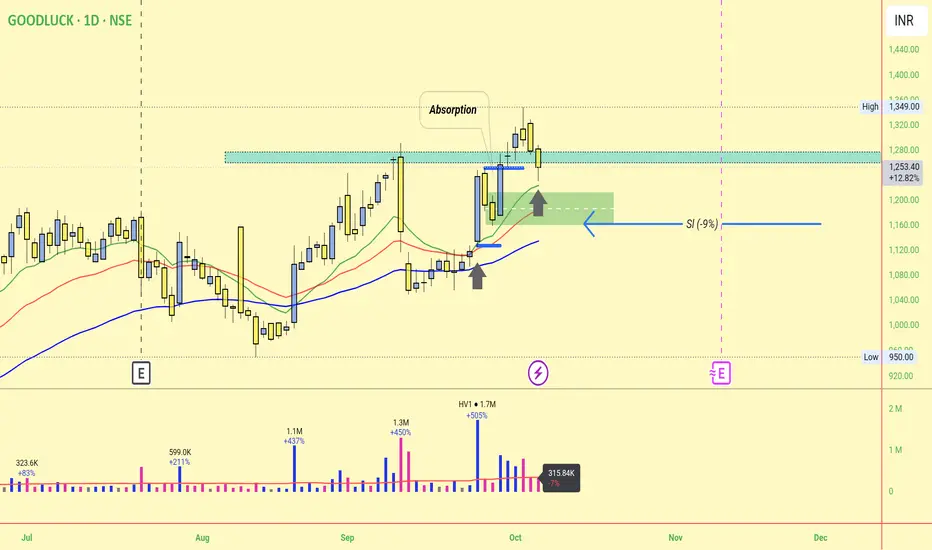
GOODLUCK – Pocket Pivot Breakout & Momentum WatchThis chart of GOODLUCK captures a significant pocket pivot breakout, followed by rapid price momentum and a clear pivot base formation. After consolidating near the 1100-1135 levels with a nonlinear base, the stock triggered a watchlist alert and surged over 10%. Multiple EMAs signal strong trend alignment, indicating renewed accumulation and breakout continuation. The setup is ideal for momentum traders monitoring high relative volume and actionable swing opportunities
GOODLUCK India Reversal SignBusiness :- Goodluck India Ltd is an engineering conglomerate engaged in the business of manufacturing and selling engineering products such as sheets, pipes, engineering structures, fabricated structures, forgings, and automobile tubes.
Clients :- Clients include NTPC, BHEL, EIL, L&T, Reliance, TATA, Audi, BMW, Mahindra, Toshiba, Indian Oil, TVS, Ashok Leyland, etc
Technicals and Trend :-
Goodluck India is coming out from long consolidation and has shown the reversal sign. The stock has bee