266.97 M
About HOUSING DEV & INFRA LTD
Sector
Industry
CEO
Sarang Wadhawan
Website
Headquarters
Mumbai
Founded
1973
ISIN
INE191I01012
FIGI
BBG000LK3S79
Housing Development & Infrastructure Ltd. engages in the real estate development and construction of residential and commercial properties and infrastructure facilities. Its projects include residential, commercial and slum rehabilitation. The company was founded by Rakeshkumar K. Wadhawan on July 25, 1996 and is headquartered in Mumbai, India.
LONG HDIL...high probability investment ideaHDIL
NSE:HDIL
Cmp - 4
Stop - Nil, Add more on relevant dips
Expectation -
T1 - 8
T2 - Open, Review at 8
Expected Holding Period - 3 months or earlier for T1
Technicals - ✅
Fundamentals - ✅
View:- Swing/Investment
Disclaimer:-
Ideas being shared only for educational purpose
Please do your own re
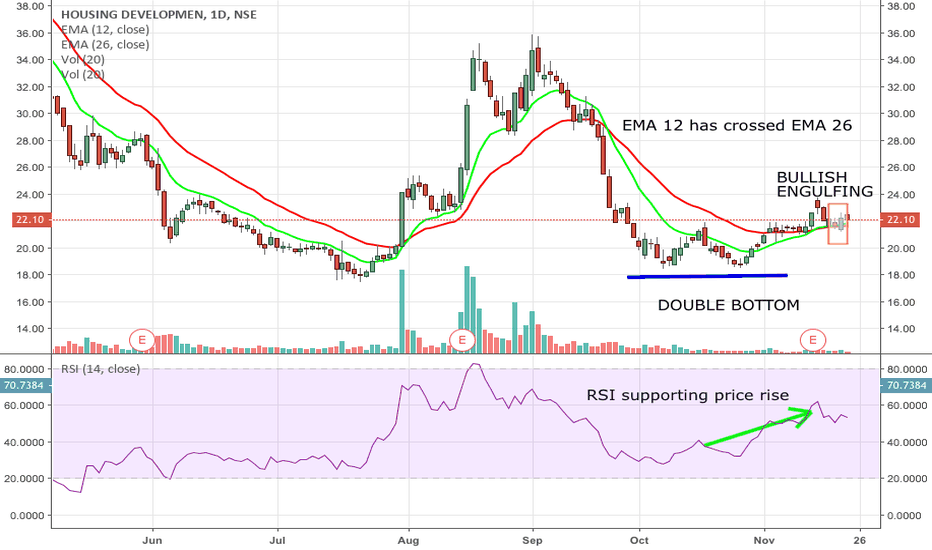
HDIlthis looks good. with double bottom in place and diagonal line breakout , its on rising line having immediate resistance zone around black line! slowly it will inch higher, if i initiate the position , i will go long. it has smaller patterns but i choose to not put it up here. they arent as clinical
See all ideas
Displays a symbol's price movements over previous years to identify recurring trends.
Frequently Asked Questions
The current price of HDIL is 4.04 INR — it has increased by 0.75% in the past 24 hours. Watch HOUSING DEVELOPMENT & INFRASTR stock price performance more closely on the chart.
Depending on the exchange, the stock ticker may vary. For instance, on BSE exchange HOUSING DEVELOPMENT & INFRASTR stocks are traded under the ticker HDIL.
HDIL stock has fallen by −2.42% compared to the previous week, the month change is a −0.25% fall, over the last year HOUSING DEVELOPMENT & INFRASTR has showed a −18.88% decrease.
HDIL reached its all-time high on Jan 10, 2008 with the price of 1,113.78 INR, and its all-time low was 1.24 INR and was reached on Mar 26, 2020. View more price dynamics on HDIL chart.
See other stocks reaching their highest and lowest prices.
See other stocks reaching their highest and lowest prices.
HDIL stock is 4.62% volatile and has beta coefficient of −0.22. Track HOUSING DEVELOPMENT & INFRASTR stock price on the chart and check out the list of the most volatile stocks — is HOUSING DEVELOPMENT & INFRASTR there?
Today HOUSING DEVELOPMENT & INFRASTR has the market capitalization of 1.90 B, it has decreased by −3.34% over the last week.
Yes, you can track HOUSING DEVELOPMENT & INFRASTR financials in yearly and quarterly reports right on TradingView.
No, HDIL doesn't pay any dividends to its shareholders. But don't worry, we've prepared a list of high-dividend stocks for you.
Like other stocks, HDIL shares are traded on stock exchanges, e.g. Nasdaq, Nyse, Euronext, and the easiest way to buy them is through an online stock broker. To do this, you need to open an account and follow a broker's procedures, then start trading. You can trade HOUSING DEVELOPMENT & INFRASTR stock right from TradingView charts — choose your broker and connect to your account.
Investing in stocks requires a comprehensive research: you should carefully study all the available data, e.g. company's financials, related news, and its technical analysis. So HOUSING DEVELOPMENT & INFRASTR technincal analysis shows the sell today, and its 1 week rating is sell. Since market conditions are prone to changes, it's worth looking a bit further into the future — according to the 1 month rating HOUSING DEVELOPMENT & INFRASTR stock shows the sell signal. See more of HOUSING DEVELOPMENT & INFRASTR technicals for a more comprehensive analysis.
If you're still not sure, try looking for inspiration in our curated watchlists.
If you're still not sure, try looking for inspiration in our curated watchlists.


